Crude Oil Tests Double Top – Brace for a Breakout
Crude stockpiles increased by 4.5 million for the week ended Oct. 18, the API said. The Energy Information Administration (EIA) 's weekly...
WTI crude oil prices are flashing red due to the data from the Amerian Petroleum Institute which showed that United States inventories increased last week. The US Crude Oil WTI futures lost 0.8% to $54.07.
Crude stockpiles increased by 4.5 million barrels for the week ended October 18, the API said. The Energy Information Administration (EIA) weekly report is scheduled to release tomorrow. Analysts expect the EIA to report a build of 2.23 million barrels.
WTI crude oil has fallen almost 18% from an April high as the United States and China trade war dragged on, and due to an increase in global supplies. The next OPEC meeting is not until December. The market will continue to trade carefully until then.
Daily Support and Resistance
S3 50.95
S2 52.52
S1 53.37
Pivot Point 54.09
R1 54.94
R2 55.66
R3 57.23
WTI Crude Oil – Forex Trading Signal
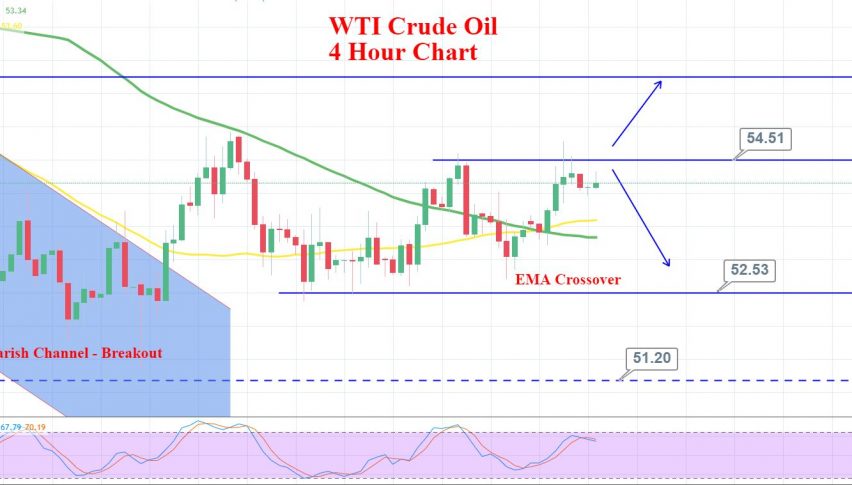
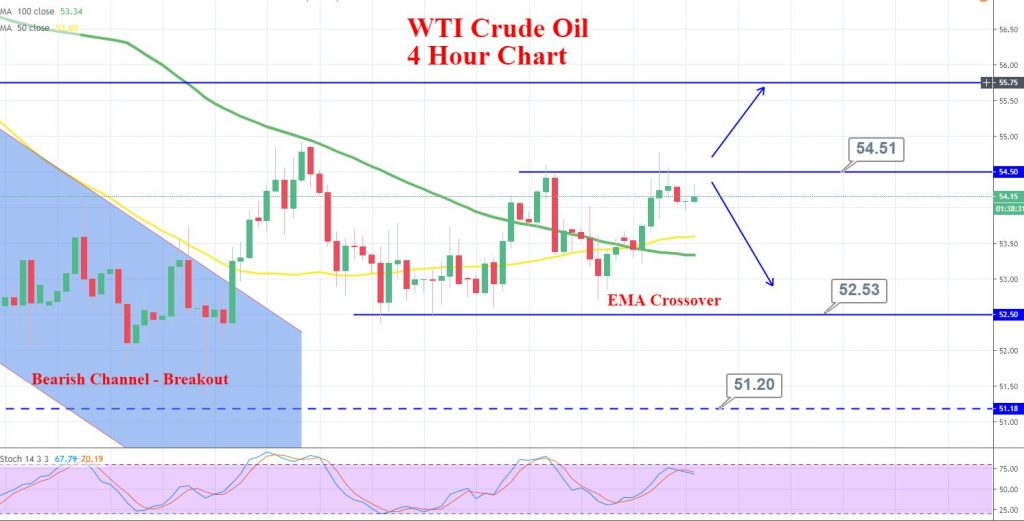
WTI crude oil is testing the double top resistance level at 54.51 area. It’s a crucial trading level to determine today’s trade plan. For instance, the bullish breakout of 54.51 level can trigger further buying in crude oil until 55 and 55.45.
Below 54.50, we can expect to sell bias to dominate and lead oil prices towards 53.60.
- Check out our free forex signals
- Follow the top economic events on FX Leaders economic calendar
- Trade better, discover more Forex Trading Strategies
- Open a FREE Trading Account