Gold Testing Double Top Pattern – Can NFP Trigger Breakout?
Gold was opened at $1494.87 and has placed a high of $1514.220 and a low of $1493.210 until now. Gold is currently trading at $1511.02 and..

Gold opened at $1494.87 and has placed a high of $1514.220 and a low of $1493.210 until now. Gold is currently trading at $1511.02 and has shown a bullish trend for the day. At 16:30 GMT, the Challenger job cuts from the United States came in at -33.5% for the month of October. At 17:30 GMT, the core personal consumption expenditure price index from the US dropped to 0.0% in the month of October from 0.1% of September. The employment cost index came in as expected at 0.7%.
However, personal spending dropped to 0.2% from the expectations of 0.3% and weighed on the US Dollar. The personal income also came in as expected at 0.3%. The Chicago PMI also dropped to 43.2 in October from 47.1 in the previous month. The awaited US unemployment claims for this week were published by the Department of Labour at 17:30 GMT, which came at 218K against the expectations of 215K, and weighed on US Dollar.
Overall the macroeconomic data on Thursday from the United States was not in favour of the US Dollar and supported the Gold prices in the financial markets.
Apart from weak macroeconomic data from the United States, GOLD prices rose on Thursday on the perception that the Federal Reserve had hinted at putting its monetary easing on hold for the foreseeable future. Meanwhile, the trend to lower interest rates remains intact in the market due to global economic slowdown.
The US 2-Year Treasury Yield bond feel by eight basis points, and 10-Year Treasury Yield bond fell by ten basis points on Thursday amid the prevailing uncertainties on US-China trade dispute. Although Donald Trump has said that a partial phase one trade deal will be signed in the coming weeks, uncertainty still prevails in the market because the deal which is going to be signed includes very little cause of dispute.
In addition, the uncertainty regarding Brexit also kept the movement of safe-haven assets like Gold in selling trends for some time. But after ruling out the possibility of no-deal Brexit and moving the Brexit deadline to 31 January, some uncertainty was removed from the market. However, the fact that UK general elections are scheduled on 12 December gave risks of failure to resolve the issues just like in 2017.
All these perceptions gave the idea that the Federal Reserve might get under pressure for easing its policy again relatively soon and creates a massive demand for Gold prices and raised the prices above $1510.

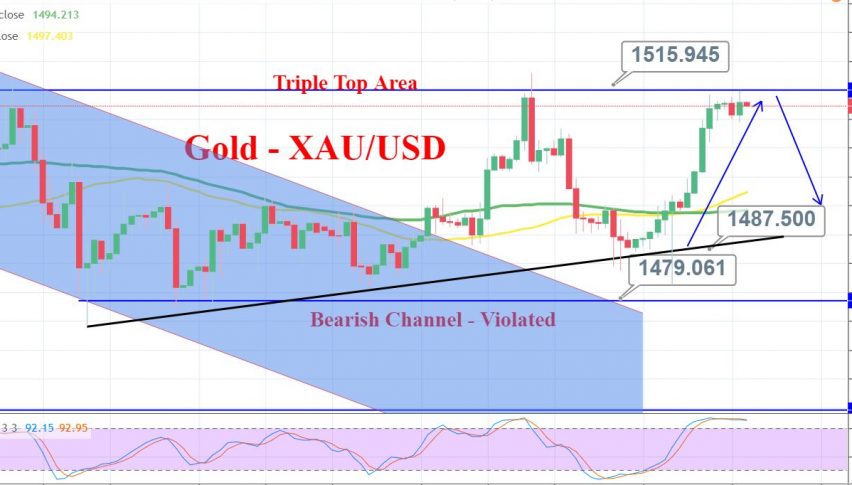
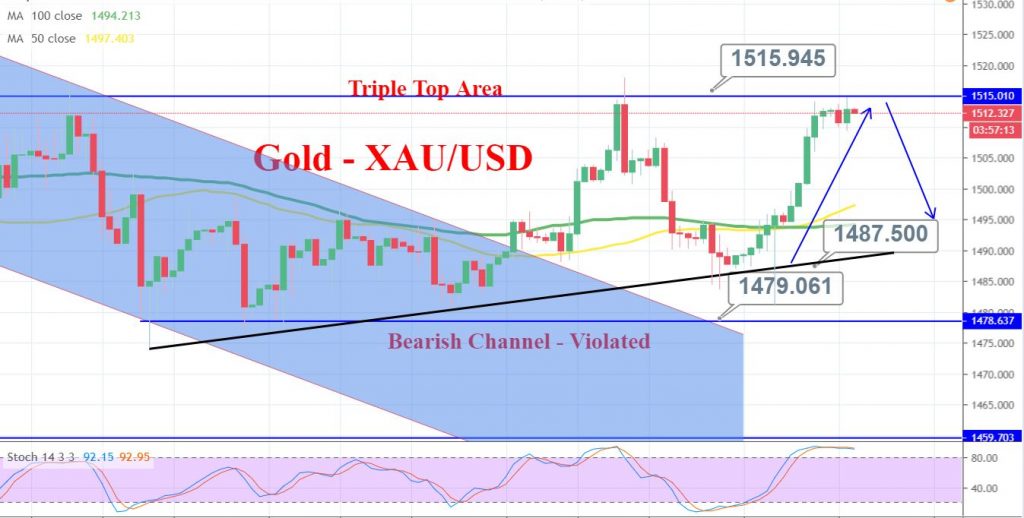
Gold 4 Hour Char
Gold – XAU/USD – Trade Idea
Gold prices are now testing the triple top level of 1,514/16. Lately, these levels have extended substantial resistance to gold bulls. Even now, the closing of doji and bearish engulfing candle on the 4-hour chart indicates high chances of a bearish reversal.
On the lower side, gold may find immediate support at 1,506 and 1,502. Whereas, the bullish breakout of 1,514 area can open further room for buyers until 1,519 and above this 1,527. NFP remains the key highlight of the day.
- Check out our free forex signals
- Follow the top economic events on FX Leaders economic calendar
- Trade better, discover more Forex Trading Strategies
- Open a FREE Trading Account


