Crude Oil Steady Below 57.45 – Traders Await EIA Inventory Data
The WTI crude oil prices flashing red mainly due to unexpected larger U.S. crude inventories build. The drop in the crude oil prices came...
WTI crude oil prices are flashing red mainly due to unexpectedly larger US crude inventories build. The drop in the crude oil prices came after the American Petroleum Institute reported overnight that United States crude inventories increase by 4.3 million barrels in the week ended 1 November to 440.5 million barrels. That was huge compared to the forecast for an increase of 1.5 million barrels.
The official data from the Energy Information Administration (EIA) is scheduled to release later in the day. The inventory data largely overwhelmed the sentiment from hopes of a breakthrough in Sino-US trade talks.
A report revealed that the United States and China were very close to singing the interim trade deal but the United States administration reportedly planned to increase tariffs on Chinese imports worth over $100 billion.
Both countries have announced tariffs on each other’s goods in a trade war that has dragged on for 16 months, which has been very bad for the global economy.
Daily Support and Resistance
S3 54.84
S2 55.96
S1 56.63
Pivot Point 57.07
R1 57.74
R2 58.19
R3 59.31
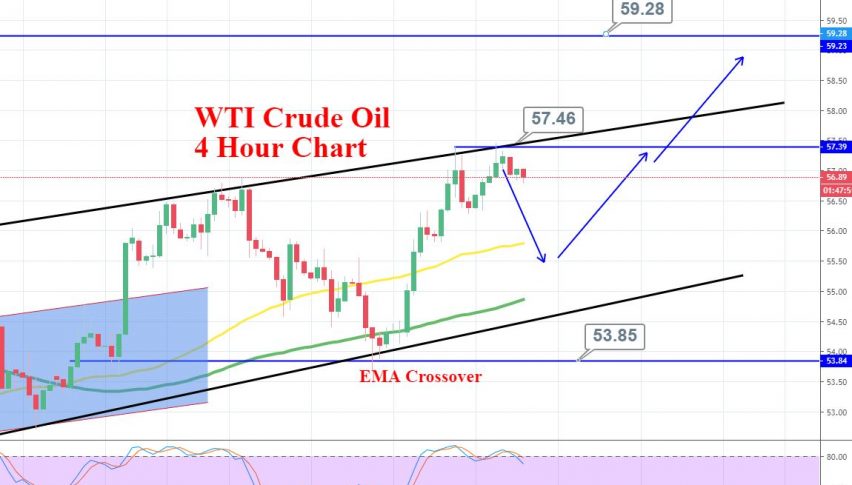
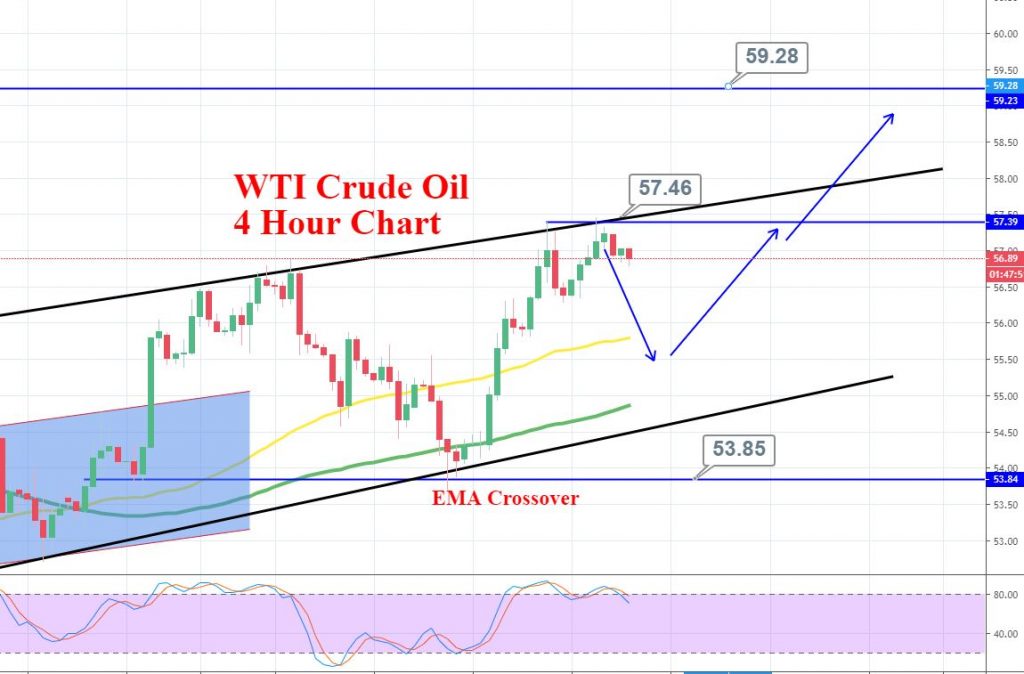
WTI Crude Oil – Forex Trading Signal
On the 4-hour chart, WTI crude oil is trading in a full bullish channel. The upper bullish line of the channel is extending resistance around 57.45 area.
Zooming in the 4-hour timeframe, we can also see a bearish engulfing candle followed by a sort of a Doji candle. It’s suggesting the chances of a bearish trend in crude oil prices.
Besides, the Stochastic, which was holding over 80 as now, started to come out of the overbought range, suggesting chances of a bearish reversal. The idea today is to stay bearish below 57.20 with a stop loss of over 57.45 and take a profit of 56.
Good luck!
- Check out our free forex signals
- Follow the top economic events on FX Leaders economic calendar
- Trade better, discover more Forex Trading Strategies
- Open a FREE Trading Account


