WTI Violates Triple Top – API Reports a Drop in Stockpiles
The WTI crude oil prices flashing green and rose by 0.6% mainly due to a decline in crude oil stockpiles, whereas the comments from the OPEC
During the early Asian session, WTI crude oil prices were flashing green and rose by 0.6% mainly due to a decline in crude stockpiles, whereas the comments from the OPEC officials regarding unexpectedly lower US production growth in 2020 also provided some support.
Although, the gains in WTI crude oil were capped by the mixed signals for oil demand in China. As we know, China is the world’s biggest crude importer, and as industrial output increased slowly during October, the oil refinery hit the 2nd-highest level throughout.
A statement from the Secretary General of the Organization of the Petroleum Exporting Countries (OPEC) Mohammad Barkindo revealed that there may be downward changes of supply going into 2020, primarily from United States shale, adding that some US shale oil firms see output growing by only 300,000-400,000 barrels per day (BPD).
It should be noted that the American Petroleum Institute reported a surprise decline in crude stockpiles by 541,000 barrels in the week to November 8, against analysts’ expectations for an increase of 1.6 million barrels. Gasoline and distillate inventories increased, the API data showed. Official weekly EIA data is scheduled for release during the US session today.
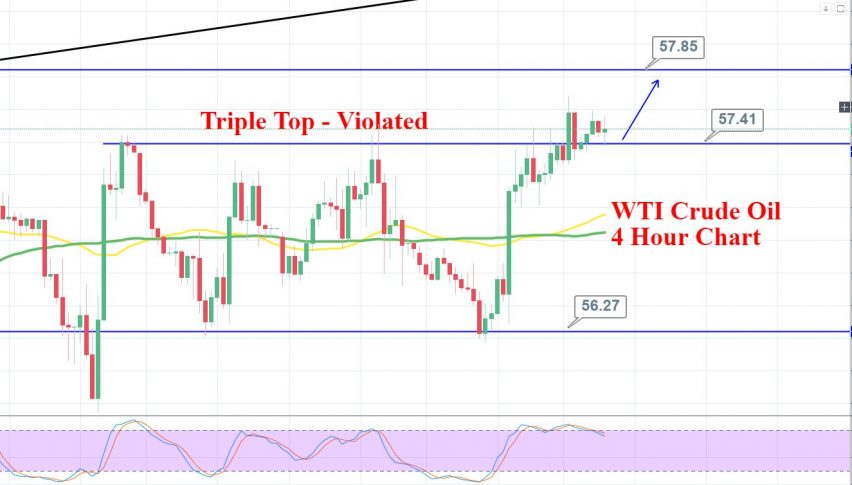
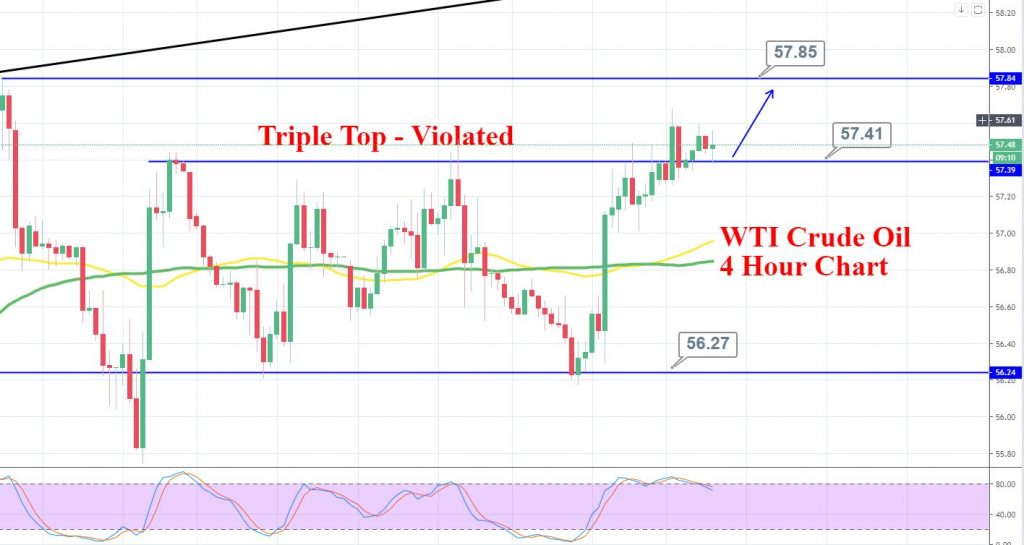
WTI Crude Oil – Technical Outlook
Crude oil prices have violated the triple top resistance level of 57.40 and closing of 4-hour candles above this level is signifying chances of further buying in US Oil.
The RSI and Stochastics are stuck in the overbought region and suggesting chances of a bearish retracement, but the candlestick is still suggesting higher odds of more buying, at least until the release of EIA inventories report.
Daily Support and Resistance
S3 54.42
S2 55.75
S1 56.58
Pivot Point 57.08
R1 57.91
R2 58.41
R3 59.74
Crude oil may stay bullish above 57 levels to target 57.85 level, which also marks a double top on the 4-hour chart. Don’t forget to follow the EIA inventories’ data to have a clear idea about US Oil’s trend.
Good luck!
- Check out our free forex signals
- Follow the top economic events on FX Leaders economic calendar
- Trade better, discover more Forex Trading Strategies
- Open a FREE Trading Account
- Read our latest reviews on: Avatrade, Exness, HFM and XM
Related Articles

Sidebar rates
Related Posts
