Gold’s Sideways Trading Continues – US Fundamentals to Trigger Breakout


What’s up, traders.
The precious metal gold continues to trade sideways as investors couldn’t find any solid reason to determine the trend of the market. Gold prices closed at $1556.220 after placing a high of $1558.170 and a low of $1546.270. Overall the movement for gold remained bullish throughout the day.
On Wednesday, GOLD prices surged after the details of the US-China trade deal were published. The details failed to soothe investors’ concerns on trade differences because Washington decided to hold some tariffs on Chinese goods. After months of negotiations, the US & China finally reached phase-one of the trade deal on Wednesday. The details of the deal revealed that the signed agreement was more limited than comprehensive, which both sides had been seeking.
Some of the details mentioned in the 86-page agreement included better protection of intellectual property by China, relaxation of barriers to trade in food & agriculture by China, and a series of measures to open the financial services sector by both countries. Apart from that, China also pledged not to force US companies for technology transfer in exchange for access to its market. Both countries assured not to devalue their currency to benefit their exporters. Over the period of 2022-21, China will buy at least $200 billion more of US products & services than it did in 2017.
The deal, however, leaves in place 25% tariffs on $250 billion worth of Chinese industrial products used by US manufacturers. As there was no complete rollback of tariffs, traders got disappointed and the uncertainty emerged in the market. These trade concerns supported gold prices on Wednesday and took them above $1558 level. According to US Treasury Secretary Steven Mnuchin, the cybersecurity & technology issues, which have been a sore point between both countries, will likely be under the focus of traders in phase-two deal’s negotiations.
The US Dollar Index weakened against the basket of six currencies on Wednesday, which added support to gold prices. The macroeconomic data related to the Producer Price Index (PPI) on Wednesday from the United States came in short of expectations and weighed on the US dollar. The Core PPI & the PPI for the month of December dropped to 0.1% from the expectations of 0.2%. The weaker than expected US data helped yellow metal prices to rise and post gains on Wednesday.

Daily Technical Levels
Support Resistance
1549.30 1560.95
1542.25 1565.55
1537.65 1572.60
Pivot Point: 1553.90
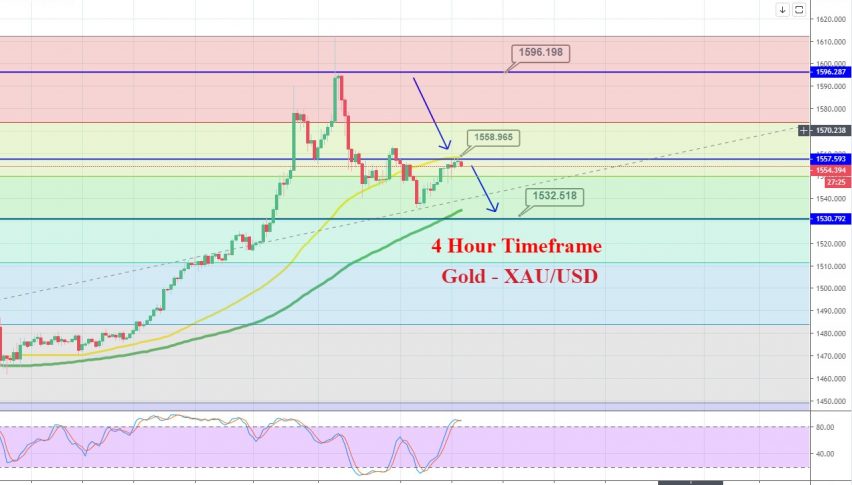
Gold has traded bullish, having formed a bullish engulfing pattern, which is followed by the hammer pattern on the daily timeframe. Typically such patterns drive bullish bias in the market. Having said that, gold is trading bullish above a strong support level of 1,553, and the continuation of trading above this level can drive more buying in gold until 1,560. Whereas, the bearish breakout of 1,553 can drive selling until 1,549. Let’s keep a close eye on 1,553 as it’s a key level for the day. Good luck!