WTI Crude Oil Violates Ascending Triangle – Who’s Up for Buying Trade?


During the late Asian session, the WTI crude oil succeeded in stopping its previous session losses, rising well above 39.00. The bullish bias was mainly triggered due to the optimism about a recovering fuel demand worldwide, backed by the upbeat U.S. crude inventories data, which showed that the crude inventories had dropped much more than expected. For all the newbies, a drop in the inventories figure suggests demand is improving, despite the spread of the coronavirus pandemic around the world.
On the other hand, the renewed geopolitical tensions triggered by the ongoing Sino-US tussle exerted some downside pressure on the risk sentiment, keeping oil prices under pressure. At the press time, the WTI crude oil is trading at 39.93 and consolidating in the range between 39.55 and 40.
During the previous session, U.S. crude was up by 54 cents, or 1.4%, at $39.81 a barrel, after losing by 1.1%. Despite the ever-increasing number of coronavirus infections in most countries, the optimism about recovering fuel demand worldwide remained strong, especially after the data showed that crude inventories in the United States fell much more than expected, by 8.2 million barrels, to 537 million barrels, against the analysts’ forecasts for a draw of 710,000 barrels.
Well, the reason for the upticks in the crude oil prices could also be attributed to the drop in output from the Organization of the Petroleum Exporting Countries (OPEC) in June, to the lowest level in two decades. On the positive side, the earlier upbeat trading sentiment was backed by the robust U.S. housing data and signs of a recovery in Europe’s economy.
Later today, the market participants will keep their eyes on the trade/virus updates, due to the lack of significant economic data to be published in the Asian session. On the other hand, the Final Manufacturing PMI and ISM Manufacturing PMI will also be worth watching. The official inventory data from the U.S. Government’s Energy Information Administration is due later.
Daily Support and Resistance
S1 35.39
S2 36.94
S3 37.58
Pivot Point 38.48
R1 39.12
R2 40.02
R3 41.57
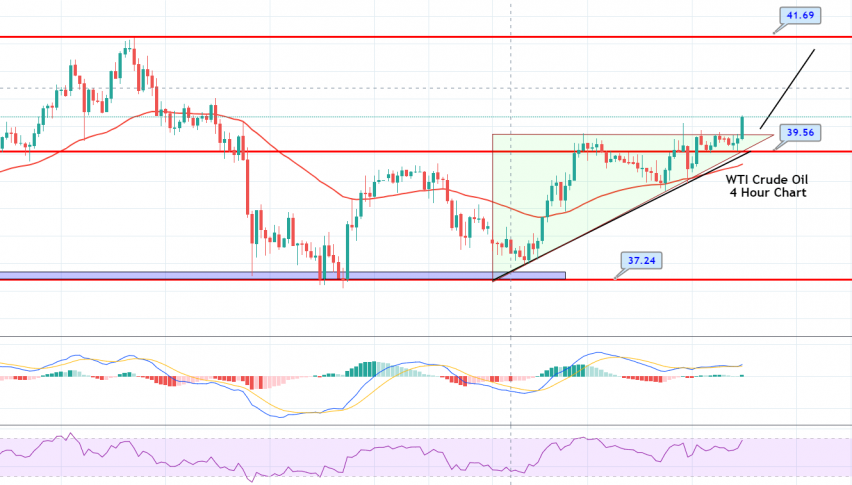
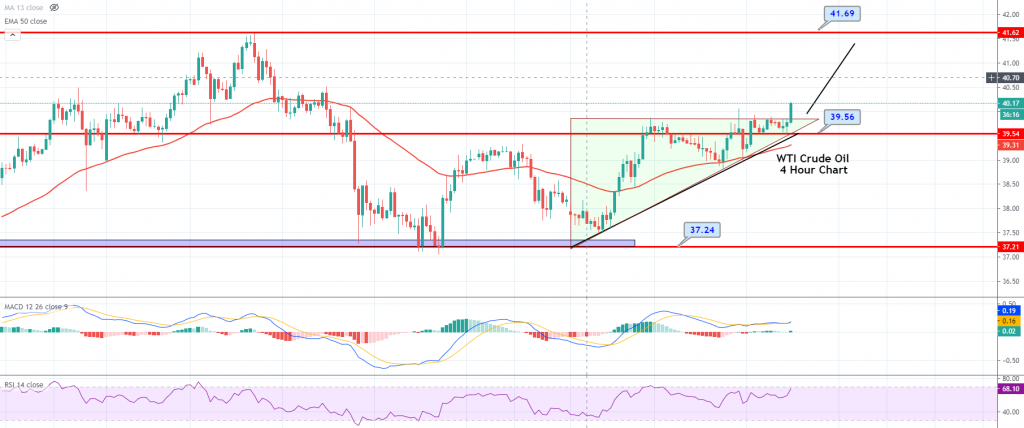
Technically, the WTI has violated the ascending triangle pattern at 40, which is suggests odds of a continuation of the bullish trend in the market. Crude oil prices could soar sharply towards the next target level of 40.50 and 41.69 level today. The support continues to hold at around 39.50 – the resistance level, which is now working as a support. The RSI and MACD are also supporting buying. Therefore, we have opened a forex trading signal to buy crude oil, with a target of 40.30. Stay tuned to our signals page for more updates. Good luck!