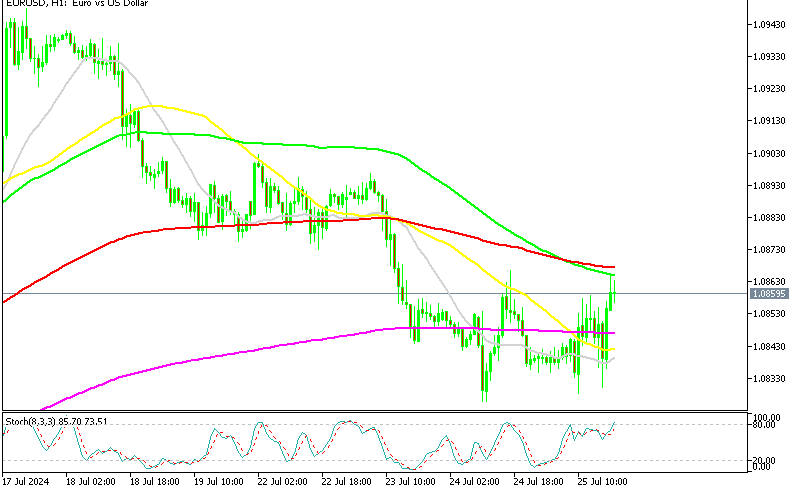
EUR/USD Stalls At Monthly Fibonacci Resistance
With a little over 24 hours left in the trading week, the U.S. indices are showing muted action. At this hour (2:00 PM EST), the DJIA DOW (-55), S&P 500 SPX (+1), and NASDAQ (+64) are holding firm. The Greenback continues to labor versus the majors, but the EUR/USD is having trouble breaking above a key Fibonacci resistance level.
On the economic news front, there will be two issues crucial to Friday’s trade:
- Stimulus: As of today, an official timetable for Congressional passage of a second stimulus bill remains unknown. However, analysts are betting that it will happen very shortly. According to Morgan Stanley U.S. equity strategist Mike Wilson, the next bill will gain Congressional approval and be a critical part of the COVID-19 recovery. So, it looks like institutional money is betting on more stimulus.
- Retail Sales: Friday’s pre-market hours bring the release of Retail Sales figures for July. The numbers are expected to contract greatly from June, but come in positive at 1.9%.
In short, the stage is set for a late-week correction in U.S. equities. A stimulus bill is unlikely to be passed in the next 24 hours and Retail Sales (July) has a good shot of lagging expectations. It’s certainly possible that bearish participation will dominate the markets going into the weekend.
Let’s dig into the EUR/USD technicals and see where this market stands.
EUR/USD Stalls At Key Resistance Level
Since the lows of mid-March, the EUR/USD has been on a freight train north. Rates are back above the 1.1800 handle and well within bullish territory. But, will the uptrend continue? If the macro 62% Fibonacci Retracement (1.1821) is taken out, then the answer is a resounding “yes.”
+2020_08+(11_10_34+AM).png)
Overview: Right now, the key number in the EUR/USD market is the 62% Fibby at 1.1821. Should we see a weekly close above this level, next week will likely bring bullish extension to August’s range. Stay tuned for a long side trading plan if the opportunity presents itself.


