Ethereum Price Forecast – ETH/USD to Hit 2,900 Target – What’s Next?


The ETH/USD closed at $2,706.19, after placing a high of $2,706.19, and a low of $2,633.79. On Wednesday, the ETH/USD recovered all of its losses of the previous day, amid the improved market mood. According to data from CoinShare’s June 1 Digital Asset Fund Flows Weekly report, the Ethereum investment products recorded inflows from institutions to the tune of $74 million in the past week. As a result, ETH products now represent more than one-quarter of institutional crypto assets under management.
According to data, a significant percentage of institutional inflows were more inclined towards Ether products. About 63% of institutional funds, comparable to $46.8 million, went to Ethereum, accounting for about 27% of the combined AUM of crypto investment products. This news added further strength to the rising prices of the ETH/USD.
A group of JPMorgan strategists, led by Nikolaos Panigirtzoglou, has warned that Bitcoin’s latest correction may not be over. Still, they have also set the long-term price target at $145,000. After dropping from $57,000 to nearly $30,000, bitcoin might be showing signs of recovery. However, strategists at JPMorgan have anticipated that the digital asset price might still drop further in the short term.
On the other hand, the co-founders of the Gemini digital asset exchange, the Winklevoss twins, have projected that the price of Ethereum could reach $40,000 in the long run, with a price target between $5,000 and $10,000 for the end of this year. Meanwhile, the US dollar also remained weak across the board on Wednesday, adding gains to the cryptocurrency Ether. The ETH/USD remained higher on Wednesday, as the US Dollar Index fell to 89.91, amid the declining US treasury yields and inflation concerns. The market mood was also dull, as the uneven economic recovery and inflation concerns added tensions and slowed the recovery in the greenback, pushing the ETH/USD higher.

ETH/USD Daily Technical Levels
Support Resistance
2,657.93 2,730.33
2,609.66 2,6754.46
2,585.53 2,802.73
Pivot Point: 2,682.06
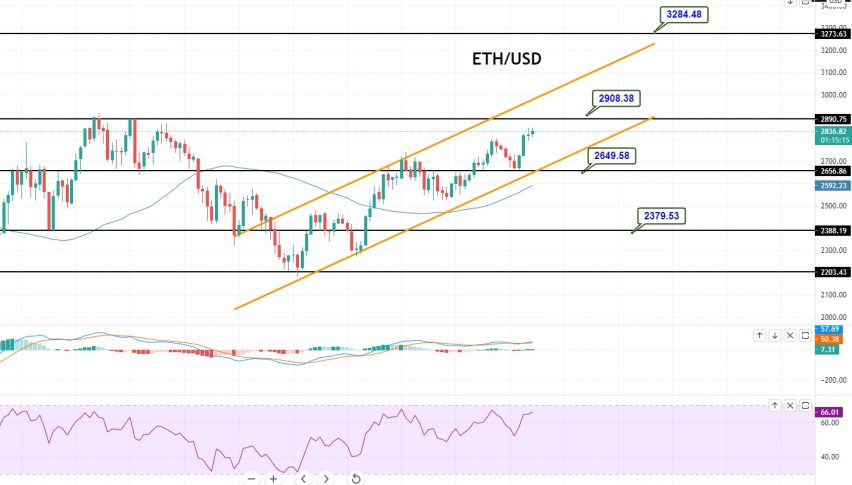
On Friday, the ETH/USD is trading with a bullish bias at the 2,837 level, and facing resistance at 2,903. On the 4-hour chart, the pair has formed a couple of bullish engulfing patterns that are keeping the pair under bullish pressure. Besides this, the ETH/USD pair has violated the trading range of 2,528 to 2,700, and closing of candles outside this range is likely to drive more buying in Ethereum. On the higher side, the ETH/USD pair may face resistance at the 2,900 level, and a breakout at this level could extend the buying trend until 3,115 and 3,285. Good luck!