During Tuesday’s early Asian trading hours, the ETH/USD coin price failed to maintain its winning streak of the previous day, edging down to below the $2,600 level. It is worth recalling that the ETH/USD coin has consolidated the accumulated gains within the moving averages. Still, the overnight bullish rally across the board placed the Ethereum price on a recovery trajectory, pulling the price above the crucial $2,800 level. The ETH price was trading at $2,844, after adding around 4.69% to its value yesterday. The strength of the coin began to open the door for a huge recovery movement, targeting $2,900. But the gains were short-lived and temporary, and Ethereum failed to clear the $2,900 resistance level and started a downside correction. However, the initially bullish bias surrounding Ethereum was mainly sponsored by the report indicating that multiple crypto funds have started seeing net inflows after weeks of record outflows. The report notes that Ether vehicles saw a total of $47 million in inflows, bringing its market dominance up to 27%.
Meanwhile, the bullish bias could also be tied to the fact that Defi protocols maintain a $48 billion total value locked (TVL), even though the sector took a significant hit after the recent Ether price crash. Furthermore, the weaker US dollar has also been playing an important role in underpinning the Ethereum prices. The ETH/USD coin price is currently trading at 2,630.56 and consolidating between 2,572.99 and 2,844.39.
On the USD front, the broad-based US dollar failed to extend its recovery moves of the previous day, turning sour on the day, because the previously released US jobs data put pressure on the greenback, as investors speculated that jobs growth was not strong enough to raise expectations that the US Federal Reserve would tighten its monetary policy. On the other hand, the previously released less positive non-farm payroll data also played a major role in undermining the US dollar. Therefore, the declines in the greenback helped to limit deeper losses in the
ETH prices. The US dollar index, which pits the greenback against the euro and five other major currencies, hit an intraday low of 89.880, whicch was below the key level of 90. On the data front, the US added just 559,000 new jobs for last month — some 90,000 below the forecast — although the unemployment rate itself fell by three percentage points, to 5.8%
Another positive factor for the ETH prices were reports suggesting that Defi protocols have maintained a $48 billion total value locked (TVL), even though the sector took a substantial hit after the recent Ether price crash. The 57% rise over the past three months should please even the most optimistic investors, but crypto traders notoriously exaggerate whatever has happened in the most recent weeks. Therefore, as Ether dropped from the $4,380 all-time high on May 12, traders quickly combined to set up protective puts down to $400.

ETH/USD Daily Technical Levels
S3 2,486.11
S2 2,651.04
S1 2,742.65
Pivot Point 2,815.97
R1 2,907.58
R2 2,980.9
R3 3,145.83The
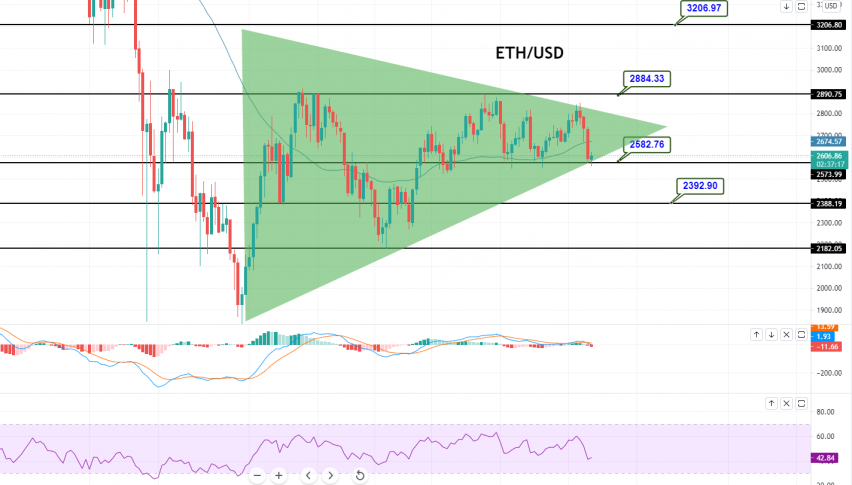
ETH/USD is trading with a bearish bias at the 2,583 level, and facing resistance at 2,880. On the 4-hour chart, the pair has formed a symmetrical triangle pattern and a triple bottom pattern that are supporting the Ethereum at 2,582. A bearish breakout of the
ETH/USD price and closing of candles below 2,582 is likely to lead the
ETH/USD pair towards the next support area of 2,392. The MACD and RSI support a selling bias in Ethereum, but Ethereum buyers are safe as long as 2,582 is intact. However, a breakout at this level could be risky for
ETH bulls. Let’s keep an eye on the 2,580 level today, as selling could be captured upon a breakout. Good luck!


