The XRP/USD closed at $0.87288, after placing a high of $0.87727, and a low of $0.81650. The XRP/USD followed the market trend set by the leading currency, Bitcoin, extending its losses in the early trading hours; however, the crypto made an upward swing and ended the day with minor gains on Tuesday.
According to some analysts, the Ripple lawsuit against the US Securities and Exchange Commission could lead to a supply shock for XRP. This could result a rise in a surge in XRP prices, as demand would remain the same while supply would plunge. So, the outcome of an ongoing lawsuit with SE would be positive for the Ripple prices. A settlement between the SEC and Ripple could effectively limit XRP sales to private companies and clients, drastically reducing the supply of tokens in the market. Analysts also believe that if the company reaches an agreement with the regulatory agency, it will become the first cryptocurrency to be 100% clear of the SEC. This added strength to the XRP/USD, pushing its prices higher on Tuesday.
Furthermore, Ripple published a proposal for a federated sidechain, to keep the main ledger lean. The developers of Ripple argued that using federation sidechains will help protect the blockchain’s leanness and efficiency for payments. The developers have been engaged with feedback and suggestions to expand the
XRP ledger, in order to integrate functionalities like smart contracts. However, the creator of Ripple has a different solution that would be better in terms of payment focus
XRP .

XRP/USD – Daily Technical Levels
Support Resistance
0.83383 0.89460
0.79478 0.91632
0.77306 0.95537
Pivot Point: 0.85555The
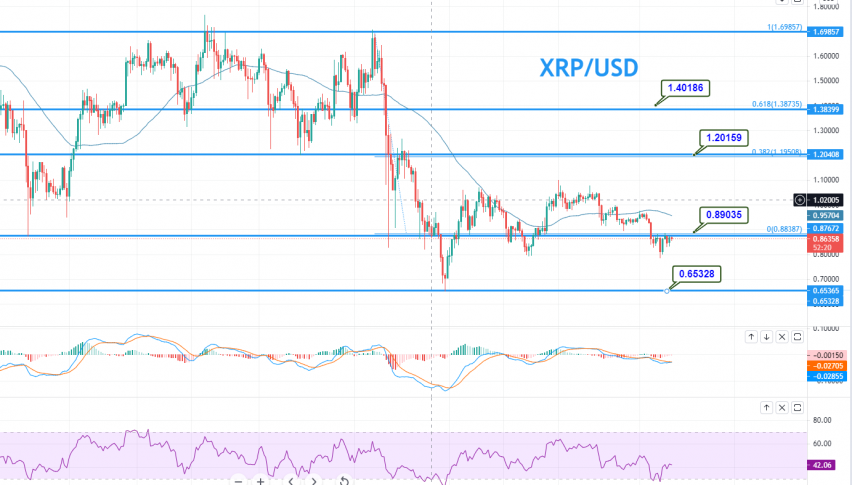
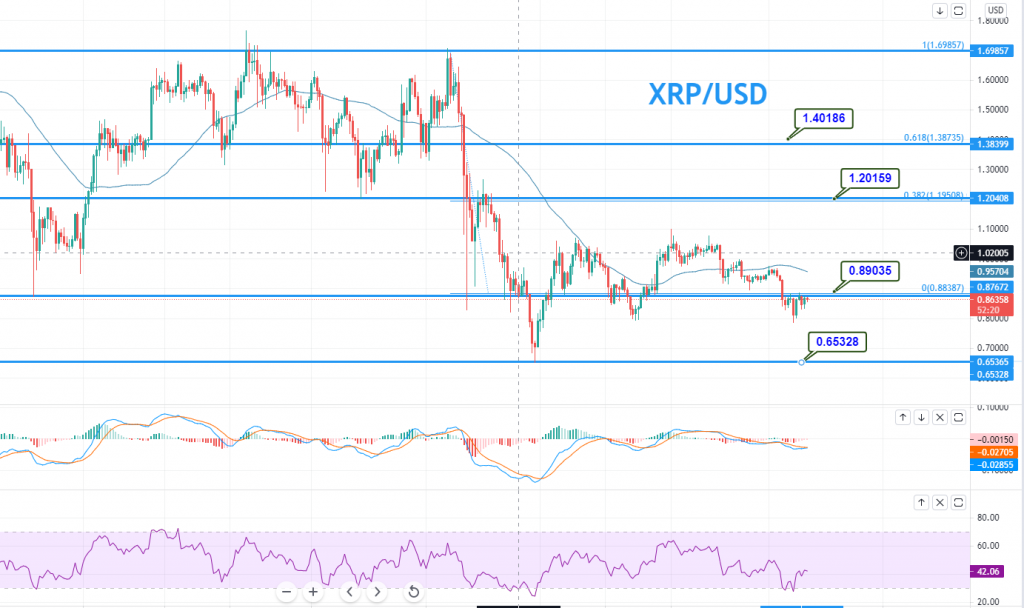
XRP/USD pair is trading sideways, maintaining a wide trading range between 1.07815 and 0.79788. A bullish crossover at the 1.0781 level could drive further buying in Ripple, until the next resistance area of 1.2948, as this marks the 61.8% Fibonacci retracement level. On the lower side, the support continues to hold around the 0.7978 area. The MACD and RSI support a bullish trend, while the EMA supports a selling bias. The idea is to take a buy trade upon breakout of the 1.0781 level. Good luck!