The XRP/USD closed at $0.92131, after reaching a high of $0.92131, and a low of $0.84759. The XRP/USD pair extended its gains on Wednesday, as Ripple proposed introducing federation sidechains, in order to unlock Defi capabilities. The Chief Technology Officer of Ripple, David Schwartz, proposed raising a federation sidechain, to enable developers to implement smart contracts and Defi capabilities adjacent to the XRP Ledger.
The chief noted that, despite the increasing demand, Ripple resisted the addition of smart contract capabilities to the Ledger of XRP. It included the risk of compromising the focus of the ledger on payments. He added that the growth of Defi on networks that use smart contracts, like Ethereum, Binance Smart Chain and Solana, has been forcing the company to take action and adding the capabilities to the XRP Ledger.
Schwartz added that implementing the federated sidechains for the ledger would allow developers to add native smart contracts that would interact with the XR token and XRP Ledger, while keeping the ledger efficient and lean. This news added strength to the rising prices of the XRP/USD on Wednesday.
The token was already rising, due to the improved
market sentiment set by the leading
cryptocurrency, the BTC. The king of the cryptos jumped higher on Wednesday, swinging the market trend to bullish, on the back of increased adoption by many countries. After El Salvador made the crypto legal tender, which will enable merchants to buy goods and services in bitcoin and the US dollar, there was a sudden jump in the crypto market prices. The
XRP/USD also followed the bullish reversal trend and continued its upward momentum for the day.
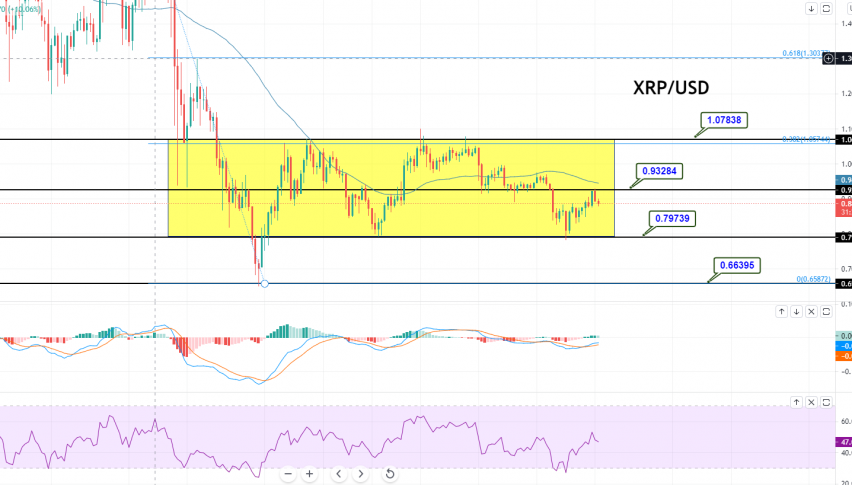
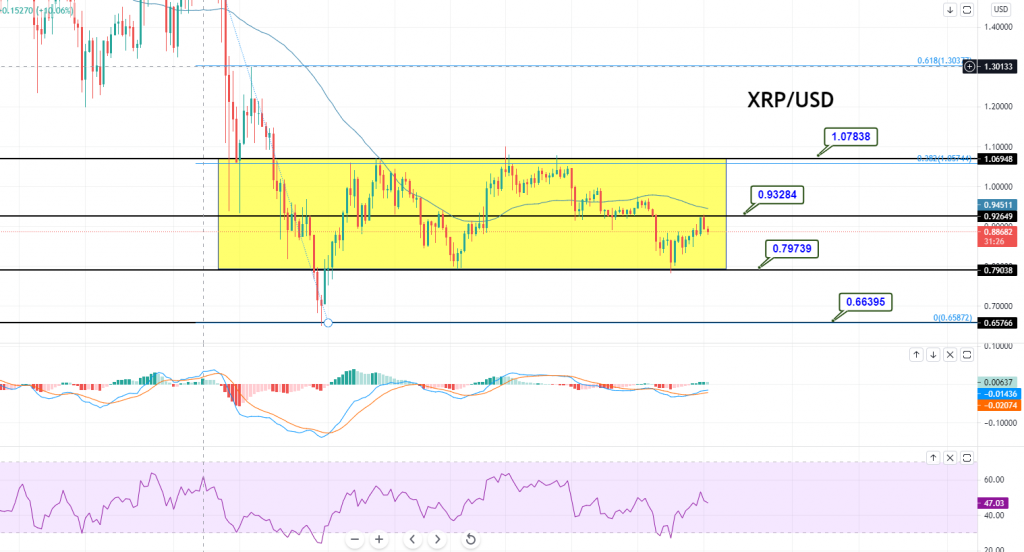
Support Resistance
0.83383 0.89460
0.79478 0.91632
0.77306 0.95537
Pivot Point: 0.85555The
XRP/USD pair is trading sideways, remaining within a wide trading range between 1.07815 and 0.79788. A bullish crossover at the 1.0781 level could drive further buying for this crypto, until it comes up against the next resistance area of 1.2948, which marks the 61.8% Fibonacci retracement level. On the opposite end, the support is still holding at around 0.7978. The MACD and RSI support a bullish trend, while the EMA supports a selling bias. We suggest taking a buy trade upon breakout of the 1.0781 level. Best of luck!