BitTorrent BTT Trapped in a Descending Channel. Should you Sell Today?

Since April, BitTorrent (BTT) has shown less power to the upside, remaining on a descending channel. The bearish momentum has been linked to the broader sell-offs in cryptocurrencies, due to regulatory rhetoric and environmental criticism.
Currently, the digital token is hovering around the 0.00248 markl, having come down from the record high of 0.0136 it reached on April 5.
BitTorrent – What is it?
BitTorrent is a peer-to-peer file-sharing platform. When using BitTorrent, content uploaders earn BTT tokens as an incentive for them to seed files for longer and dedicate more storage and bandwidth to Torrent clients.
According to its website, BitTorrent has at least two billion users, with an active user base of 100 million, making it one of the world’s largest distributed networks.
Currently, BitTorrent carries a market cap of about $1.6 billion, which is less than half of the almost $4 billion that it achieved at its peak in April. Nonetheless, BitTorrent, which was acquired by Justin Sun for only $180 million in 2018, carries a growth story.
BTT/USD – Technical Outlook
BitTorrent Current Trend: Bearish
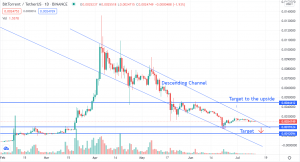
From the daily chart above, it is clear that BitTorrent has been on a downtrend since the record high in April
On June 22, prices bounced off from the support area around 0.0019124, at the lower end of the channel, after forming a bullish pin bar, which allowed the bulls to take charge and pushed BitTorrent to a short advance.
The bullish momentum is now waning, and prices remain trapped within the descending channel on the upper end, with the bears ready to pounce in to push the price lower.
BTT/USD Trade Idea
Currently, the BTT/USD price has no confirmed trade setup. Nonetheless, the technical analysis reveals a potential sell trade, in the short term, in line with the general bearish trend.
For a potential sell trade, I recommend that a sufficient break below the 0.0019124 support must be observable. Sell trades taken at this level should target the next support at around 0.0012094.
Alternatively, I will be looking at a potential buy trade, after prices break away from the descending channel to the upside, as this is likely to happen after prices retest the 0.0019124 support level, before flipping to the upside.
A buy trade once prices break the descending channel to the upside, should target 0.0044412, which is the established resistance level.
What to Look For?
Besides watching the BTT/USD technical levels, I will keep a keen eye on market developments regarding crypto regulations and other moves in the cryptocurrency industry.
Positive developments could again reignite the bullish momentum witnessed in April, that could see BTT/USD breaking even higher, past the 0.0044412 level, and possibly, surpassing its previous record high.
For now, I recommend that traders stay on the sidelines, as they watch the key levels before making a potential sell or buy trade, based on the above analysis. Happy trading!
- Check out our free forex signals
- Follow the top economic events on FX Leaders economic calendar
- Trade better, discover more Forex Trading Strategies
- Open a FREE Trading Account
- Read our latest reviews on: Avatrade, Exness, HFM and XM
Related Articles
Sidebar rates
Related Posts
