Solana Breaks Above the Descending Trendline. Is it Time to Buy

Solana has been on a bullish momentum for a while now, and it seems unlikely that it will stop any time soon. In the previous outlook, it was predicted that it would bid for higher prices, if it were able to break above the daily descending trendline, which has been keeping buyers out.
Now, SOL/USD has breached the descending trendline on the daily chart, and more upsides are likely. But, should you buy it today?
SOL/USD – A Technical Outlook
Solana Daily Chart Analysis
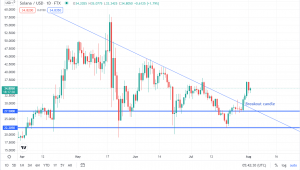
As observed on the daily chart above, SOL/USD is now trading above the trendline on the daily chart. A bullish breakout candle can be seen towering above the daily trendline, giving buyers more confidence to jump in.
What Happened in the Past Week for SOL/USD?
Solana’s rise can be attributed to the uptick in prices in the broader cryptocurrency industry. However, the digital token got another boost from the famous Lollapalooza music festival.
According to Decrypt, Solana featured strongly on the opening day of the music festival on July 29. Headline acts by famous singers and celebrities, like Miley Cyrus, featured alongside Solana, which helped the crypto to surge.
What is Next for SOL/USD?
After a sufficient break above the descending trendline, my long-term view of SOL/USD is a buy. However, checking on the 4-hour chart analysis, I will wait for a price retracement before entering the trade.
Solana 4-Hour Chart Analysis
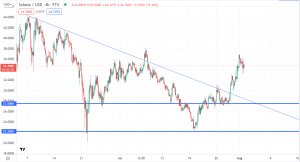
From the 4-hour chart above, it can be seen that Solana is finding it difficult to break past the minor resistance at 36.9. Prices are retreating after testing this level, and they could be headed lower before more bulls jump in.
Trade Idea
I am keen for prices to retreat to around 30.00-32.00 before entering a buy trade. I consider this level as an important market event area, as prices have shown indecision before. The level is also around the breakout candle, which means it is a critical area to watch.
The formation of bullish trade signals at the 30.00-32.00 level would allow me to enter a buy trade with a better risk-reward ratio of at least 1:3. For the buy trades, my targets will be at the previous high of 36.9, and potentially at 40.8.
I will place a stop loss below the breakout candle on the daily chart. The stop loss placement ensures that I am below where SOL/USD turned bullish, in order to increase the chances of having a successful trade. Good Luck!
- Check out our free forex signals
- Follow the top economic events on FX Leaders economic calendar
- Trade better, discover more Forex Trading Strategies
- Open a FREE Trading Account
- Read our latest reviews on: Avatrade, Exness, HFM and XM
Related Articles


Sidebar rates
Related Posts
