All Eyes on Crude Inventories, CPI, as Oil Recovers Some Losses

After demonstrating a stellar rise since the start of this year, oil is now under threat of further weakness. On Monday, oil lost as much as 4% due to demand concerns following a fresh outbreak of the Delta COVID-19 variant.
Monday’s sell-off saw Brent crude trading at around $67.87 a barrel, while the West Texas Intermediate, which had shed by a larger percentage, was trading at around $65.38 a barrel.
However, XTI/USD bulls are not done yet, as oil gained more than 1% during early trading on Tuesday, recovering some of the losses it sustained the previous day.
XTI/USD – A Technical Outlook
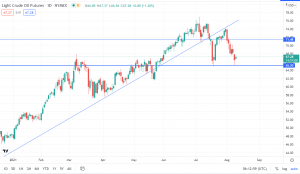
Oil Daily Chart Analysis
Observed on a daily chart, oil breached the ascending trendline after hitting a price above $75 a barrel. Trading on the precious commodity is now contained below the ascending trendline, with bulls finding it hard to break above the $74.00 a barrel barrier.
Following the sell-offs of last week and Monday, XTI/USD touched the $65.20 level, which has now turned into a support zone.
A spot-check of XTI/USD illustrates an upside momentum that is already developing from a bullish pin bar at the support. Another bullish pin bar formed on July 20 – it took prices higher, marking the $65 level, which is an important area to watch when trading XTI/USD.
Could We See More Upside for Oil?
I maintain a short-term bullish view of XTI/USD, in line with the developing upside momentum from an already established support and pin bar trade signal. However, I expect oil to find a lot of resistance crossing the $71.0 a barrel price level.
Let’s have a look at the 4-hour chart below:
XTI/USD – A Technical Outlook on a 4-Hour Chart
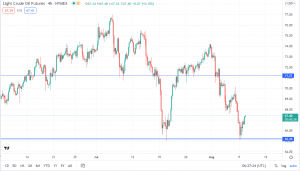
From the 4-hour chart above, we can see that the $71.00 area acted as a minor support/resistance before. Although prices have managed to break above or below it several times, the current weaknesses in oil could pose a major challenge to it breaking to the upside. Thus, I would take profits at the $70-$71 a barrel price level, although further upsides until the previous ascending trendline on the daily chart are possible.
Key Developments to Watch
COVID-19 Outbreak-Related Restrictions
Up to now, it has been clear that weaknesses in oil have been largely attributed to the outbreak of the Delta variant of the coronavirus. As was previously reported by WSJ, China, which is the world’s largest oil importer, said it will cancel large events in August, in an effort to tame the spread of the Delta variant.
With more countries potentially reintroducing restrictions to limit the spread of the Delta variant, the demand for oil could plummet, making a sustained increase in the oil price difficult.
US CPI Data
The US is expected to report consumer price data on Wednesday, that could alter the market sentiment on the Fed’s policy. A more-than-expected jump in inflation could advance the idea of the Fed’s stimulus tapering. This, in turn, could add strength to the dollar, which has already been buoyed by strong non-farm payroll jobs data for July.
Crude Inventories
US crude inventories data on Wednesday would be a market mover for oil. Crude oil jumped by 3.63 million barrels for the week ending July 30. A further surge this week could result in weakness in the XTI/USD, as it would signal low demand relative to supply.
OPEC+ Oil Production Policy (Medium to Long-term)
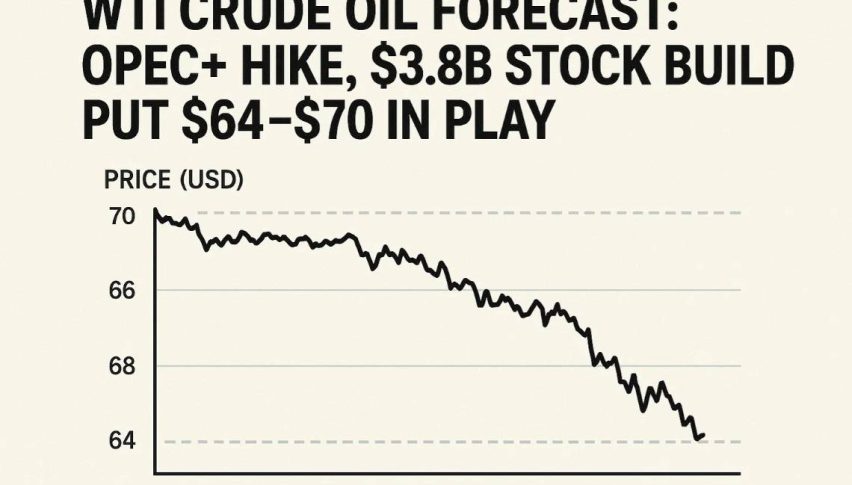
In the past, OPEC+ has hinted at easing oil output curbs, which could see more supply in the market and tame the prices. Although the renewed outbreak of COVID-19, could signal a wait on their output policy, it can’t be ruled out that they will act as planned. More oil, coupled with the coronavirus situation, could expose oil to further weakness below $65 a barrel.
- Check out our free forex signals
- Follow the top economic events on FX Leaders economic calendar
- Trade better, discover more Forex Trading Strategies
- Open a FREE Trading Account