Stellar Lumens (XLM/USD) Retreats to Support. Is $0.43 a Realistic Target?

After recording a stellar momentum in the last seven days, the crypto bulls seem to be running out of gas.
Tuesday trading showed that most cryptocurrencies retreated as buyers booked profits. At the time of writing, major cryptocurrencies BTC/USD and ETH/USD were trading at -2.07% and -3.81% respectively, in the last 24 hours.
Stellar, a crypto token whose website mentions that it provides an open network for storing and moving money, was down 7.61% in the last 24 hours, but had a positive 6.83% seven-day change. However, the retreat in Stellar Lumens (XLM/USD) provides an opportunity for buyers to enter a trade with a potential for a better risk-reward ratio.
But, let’s first do a quick technical analysis of the crypto token.
XLM/USD – A Technical Outlook
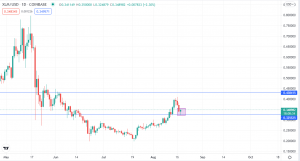
Stellar Lumens Daily Chart Analysis
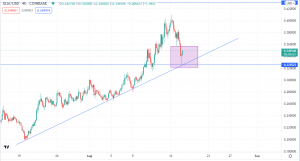
Stellar Lumens 4-Hour Chart Analysis
Observed on a daily chart analysis, XLM/USD is currently sitting on a support around 0.3255. A bullish pin bar can be seen emerging from the support area, which could push the prices higher.
Conversely, on the 4-hour chart analysis, we can see that a bullish pin bar has already formed at the same support level of 0.3255. Prices are bouncing from the support after the formation of the pin bar. Similarly, the bullish pin bar has formed at the point where the support area meets the ascending trendline. This means that XLM/USD has not breached the ascending channel, to consider further downsides from the current retreat possible.
XLM/USD Trade Analysis and Idea
Combining the daily and 4-hour chart gives a better view of the potential for XLM/USD. Focusing on the 4-hour chart, we can see that XLM/USD is still within the ascending channel, despite a 24-hour plunge in the crypto market. We expect the bullish pin bar on the 4-hour chart to support the prices, at least in the short-term.
But, with the current bearish turn of cryptocurrencies in the last 24 hours, I advise that we wait for the closing of the candlestick on the daily chart for trade confirmation in XLM/USD. I will pay attention to the bullish signal that is currently forming on the daily chart at the support area of 0.3255 before entering a buy trade.
XLM/USD Target
I will target the resistance area around 0.43 for a buy entry in XLM/USD. Prices rallied towards this area in the surge last week, hitting a high of about 0.40 before retreating. Now, I expect the next bullish turn on XLM/USD to reach the resistance area. However, I will take some profits at the 0.40 area and allow the trade to continue running, aiming for the 0.43 level. Good luck!
- Check out our free forex signals
- Follow the top economic events on FX Leaders economic calendar
- Trade better, discover more Forex Trading Strategies
- Open a FREE Trading Account
- Read our latest reviews on: Avatrade, Exness, HFM and XM
Related Articles


Sidebar rates
Related Posts
