Polkadot Trading Below the Ascending Channel. Should you Sell Today?
After posting a strong bullish run since 21 July, Polkadot (DOT/USD) seems to have now lost the momentum. The crypto token tried to break
After posting a strong bullish run since 21 July, Polkadot (DOT/USD) seems to have now lost the momentum. The crypto token tried to break past a high of around 29, which is a resistance area, only for bears to jump in and take it lower.
Now DOT/USD seems to be heading lower, after a break below an ascending trendline, which started more than a month ago.
– A Technical Outlook
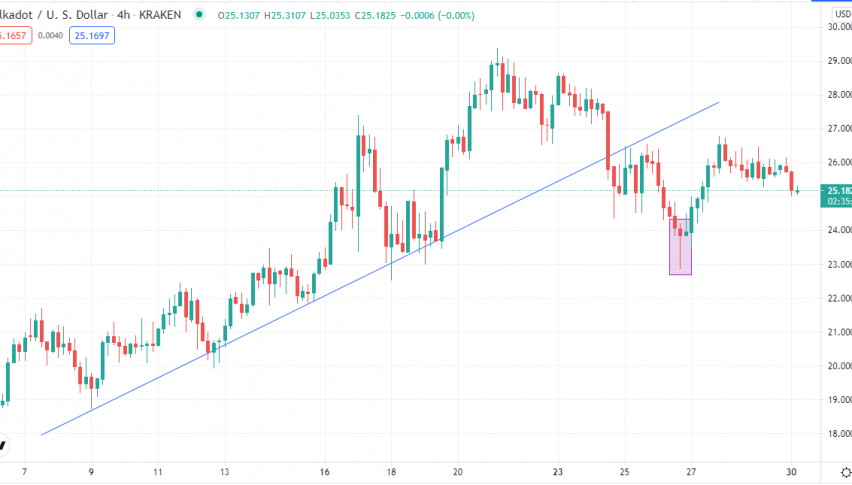
Taking a look at the DOT/USD 4-hour chart shows that the crypto token broke below the ascending trendline on August 24. It then proceeded lower, before forming a bullish pin bar, at a minor support, on August 26. The bullish pin bar tried to take the price higher before retreating again just below the ascending trendline.
At the time of writing, DOT/USD was trading within narrow ranges at 25.11, and seemingly finding a lot of resistance going higher. From a technical perspective, it could extend consolidation and potentially retreat down before finding a new bullish momentum. But, should you sell DOT/USD?
Let’s look at its daily chart:
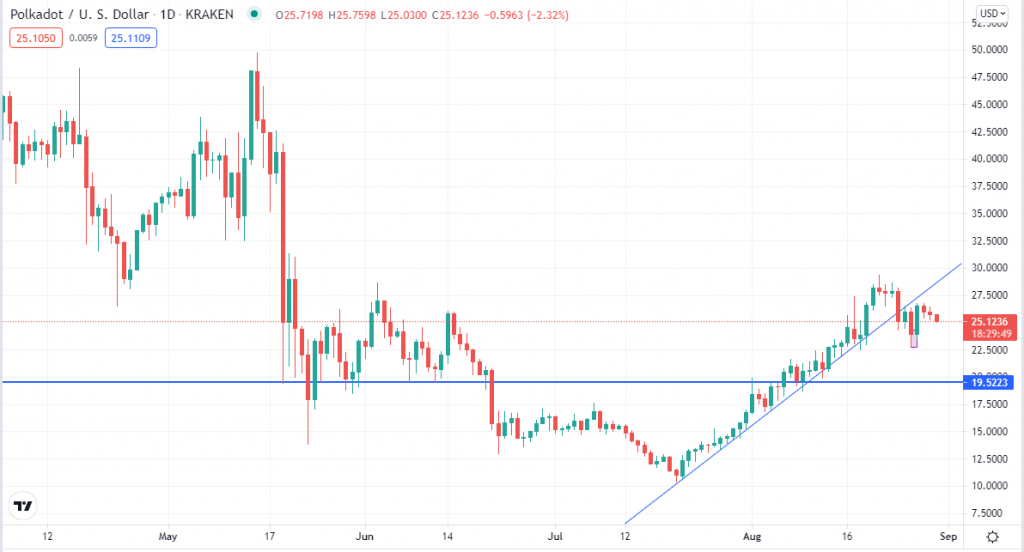
Just like on the 4-hour chart, the daily chart shows that DOT/USD is trading below the ascending trendline. The chart shows that DOT/USD is retreating lower from the resistance area and a break below the ascending trendline gives potential clues of a further downside.
DOT/USD Trade Analysis
Based on the 4-hour and daily chart analysis, I expect DOT/USD to trade lower. However, I do not interpret the current break below the ascending trendline as a turn to a bearish momentum.
Clearly, DOT/USD is in a consolidation mode after failing to break past the resistance area around $27 to $29. The consolidation is also seen across other major cryptocurrencies, with Bitcoin down 0.75% while Ethereum was trading lower by 0.81% in the last 24 hours, taking 7-day losses to 4.47% and 4.89%, respectively.
DOT/USD Trade Idea
Although I see a short-term bearish momentum on DOT/USD, I do not recommend a sell trade at the moment. Entering a sell trade contradicts the bullish momentum which DOT/USD demonstrated for over a month, and upsides on the pair can be quick leaving shorts exposed.
Based on the above analysis, I would recommend traders wait for DOT/USD to retreat, preferably to the long-established support at 19.5 on the daily chart. If prices retreat to the 19.5 level, buy trades can be entered, upon confirmations through price action trading signals, with a much lower risk to return ratio.
An alternative scenario is where DOT/USD fails to break below the minor support at 23.5 on the 4-hour chart. Again, I will be keen on the formation of buy trade signals at the level for long entries on DOT/USD. Good luck!
- Check out our free forex signals
- Follow the top economic events on FX Leaders economic calendar
- Trade better, discover more Forex Trading Strategies
- Open a FREE Trading Account