Gold Retests 50 SMA at $1,732 – All Eyes on Final US GDP
Gold prices were closed at $1728.75 after reaching a high of $1745.95 and a low of $1721.25. Gold dropped for the second day on Wednesday
Written by:
Arslan Ali Butt
•
Thursday, September 30, 2021
•
2 min read
•
Last updated: Thursday, September 30, 2021

GOLD closed at $1,728.75, after reaching a high of $1,745.95, and a low of $1,721.25. Gold fell for the second day in a row on Wednesday, dropping to its lowest level since August 10, amid the sudden spike in the US dollar. The US Dollar Index, which measures the greenback’s value against a basket of six major currencies, rose to a 12-month high of 94.43, amid rising expectations that the US Federal Reserve will soon begin to taper its economic stimulus measures.
On the data front, at 19:00 GMT, the Pending Home Sales for August were released, showing a surge to 8.1%, against the forecast of 1.1%. This supported the US dollar and dragged the gold prices further to the downside. The 10-year Treasury bond yield fell for the first time in six days on Wednesday, reaching 1.49%.
On Wednesday, the Chairman of the Federal Reserve, Jerome Powell, acknowledged that the central bank’s two goals were potentially in conflict. He said that the most urgent issue facing the Fed was to resolve tensions between still-elevated unemployment and high inflation. Powell stated that it had been a long time since the Federal Reserve had faced a situation like this, in which the bank’s two objectives were at odds with one another, as inflation was high and above target, while the labor market had yet to recover. Powell was concerned about the possible clash between the two goals of stable prices and full employment, as this could lead to a situation where the Fed might be forced to make trade-offs between the two. In order to do so, the Fed might raise interest rates, in an effort to tame prices, whilst at the same time wanting to encourage job growth.
These remarks by the Chairman of the Federal Reserve bolstered the US dollar and contributed to the losses in the yellow metal on Wednesday. Meanwhile, on Tuesday, St. Louis Federal Reserve President James Bullard said that high inflation might require more aggressive steps by the central bank, including two interest rate hikes in 2022. These comments provided additional strength to the rising US dollar, pushing its prices higher, which added to the burden on the prices for the yellow metal.
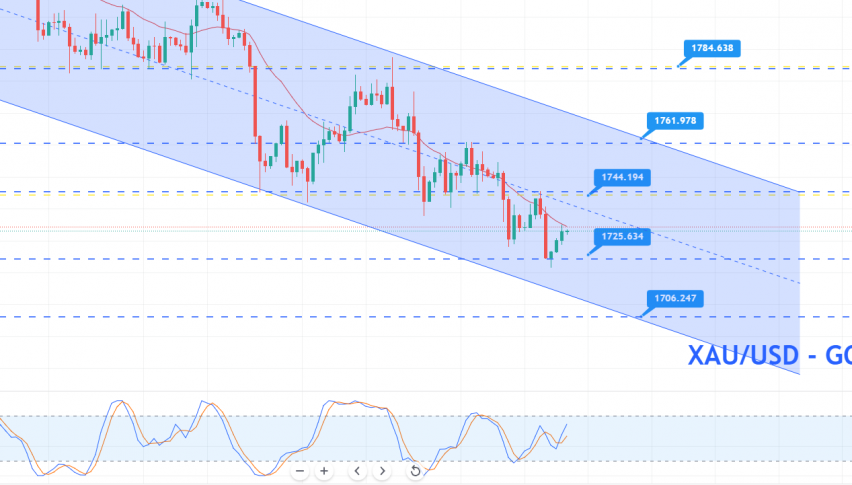
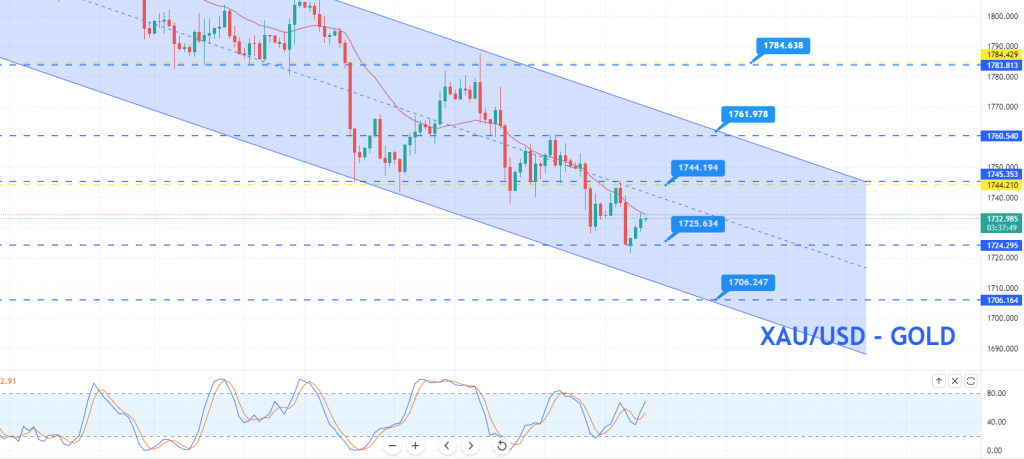
Gold (XAU/USD) Technical Outlook – Descending Channel in Play
Gold is trading with a bearish bias at the 1,733 level, and facing immediate resistance at 1,739. An intraday pivot point level is extending immediate support at 1,731.98. On the 4-hourly timeframe, the precious metal is consolidating above the pivot point level, as investors are awaiting the final US GDP before placing any significant position.
Furthermore, the 50-day SMA (simple moving average) at 1,732 suggests a selling trend in GOLD. Moreover, the closing of candles below the 1,732 level supports chances of a continuation of the bearish trend. On the 4-hour timeframe, the precious metal has formed a descending channel, which supports a selling trend in gold.

Daily Technical Levels
Support Resistance
1,718.01 1,742.71
1,707.28 1,756.68
1,693.31 1,767.41
Pivot Point: 1,731.98
On the lower side, immediate support for gold prevails at 1,725 and 1,718, with the next resistance holding at around the 1,742 and 1,756. Let’s consider selling below the 1,732 level and vice versa. Good luck!
Arslan Ali Butt
Lead Markets Analyst – Multi-Asset (FX, Commodities, Crypto)
Arslan Ali Butt serves as the Lead Commodities and Indices Analyst, bringing a wealth of expertise to the field. With an MBA in Behavioral Finance and active progress towards a Ph.D., Arslan possesses a deep understanding of market dynamics.
His professional journey includes a significant role as a senior analyst at a leading brokerage firm, complementing his extensive experience as a market analyst and day trader. Adept in educating others, Arslan has a commendable track record as an instructor and public speaker.
His incisive analyses, particularly within the realms of cryptocurrency and forex markets, are showcased across esteemed financial publications such as ForexCrunch, InsideBitcoins, and EconomyWatch, solidifying his reputation in the financial community.