Cardano Price Analysis: Who’s Ready to Trade for ADA/USD Buy-limit?


Cardano was left in the dust when the Securities and Exchange Commission (SEC) authorized the first Bitcoin exchange-traded fund (ETF) earlier this week. Over the last two weeks, speculation that the US regulator will give the go-ahead, has grown. The Cardano price analysis remains bearish, as the ADA/USD keeps pushing lower, towards the support level of $2.077.
According to CoinShares, the SEC’s recent approval of a Bitcoin ETF could result in significant additional inflows in the coming weeks, as American investors begin to add positions.
Bitcoin dominated the inflows, accounting for 87.5 percent of the overall amount, resulting in a total of USD 70 million, which marked the top cryptocurrency’s fifth straight week of inflows. Other cryptocurrencies appear to have suffered as a result.
ADA/USD Live Rate
[[Cardano-graph]]
Inflows into Polkadot and Cardano were USD 3.6 million and USD 2.7 million respectively. Another prominent alt-coin, Solana, experienced outflows of USD 0.3 million.
After it was cleared for listing on the Nasdaq platform last week, Bloomberg ETF analyst Eric Balchunas anticipated that a second Bitcoin futures contract-based ETF, the Valkyrie Bitcoin ETF, is likely to be launched later this week.
According to coinmarketcap.com, Bitcoin surged slightly more than 9% to USD 62,500 in the seven days until October 19, and it went up another 2% today. Cardano was down 0.5 percent in the same period.
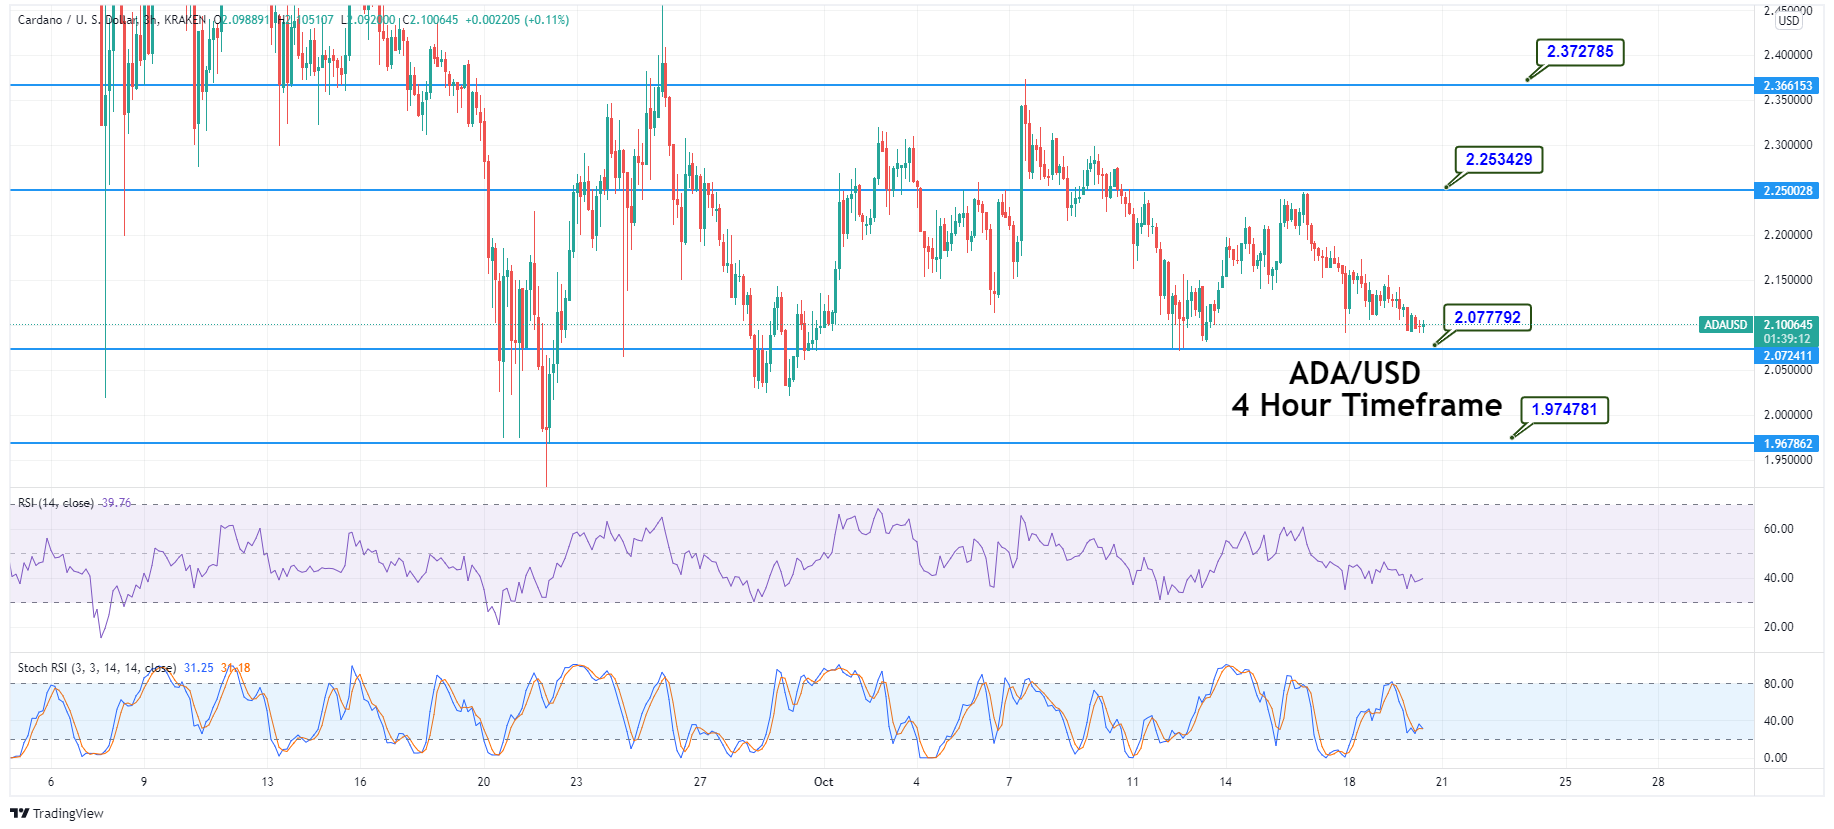
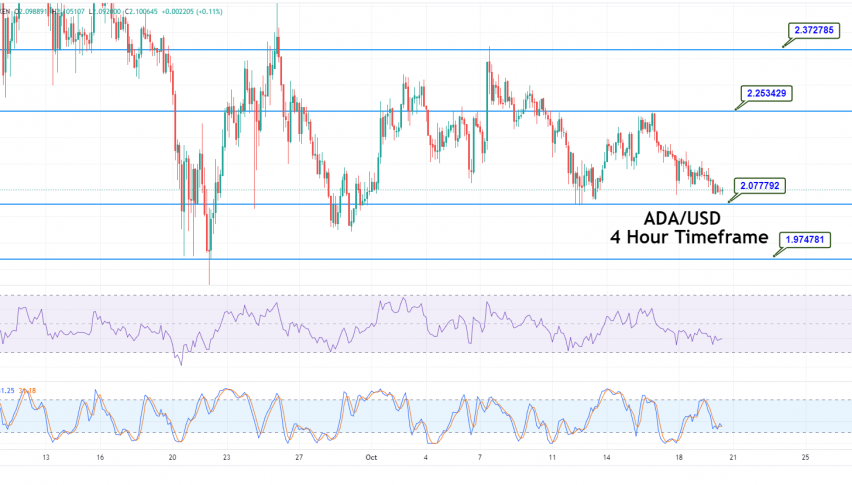
Cardano Price Analysis: Double Bottom Support at $2.077
The ADA/USD price prediction remains steady at the 2.1020 level, gaining immediate support at the 2.0777 level. On the 4-hour timeframe, the ADA/USD has closed a Doji pattern right above the double bottom support level of 2.077. If the price falls below 2.077, it is likely to find immediate support at 2.01 and 1.97.
On the higher side, the resistance remains at levels of 2.20 and 2.2534. The RSI and stochastic support the selling trend. However, closing above the 2.0770 level could offer us a nice buy trade. Thus, the idea is to place a buy limit at the 2.0777 level, to target 2.2010 and 2.2534. Good luck!