AXS/USD and FTM/USD Break Above the Descending Trendline. Are More Upsides Likely?
Axie Infinity (AXS/USD) has performed dismally in November, falling from a high of around $165 on November 6 to a low of about $122 on Nov
Axie Infinity (AXS/USD) Seeking Buyers after Breakout
Axie Infinity (AXS/USD) has performed dismally in November, falling from a high of around $165 on November 6 to a low of about $122 on November 18. The decline was connected to the broader rout in cryptocurrencies as traders took profits following massive rises across the board in October.
The crypto market is recovering from an industry-wide rout that saw Bitcoin and most altcoins plummet. Axie Infinity seems to be benefiting from the comeback. At the time of writing, AXS/USD had gained 6.64% in the past 24 hours and 2.63% in the past week.
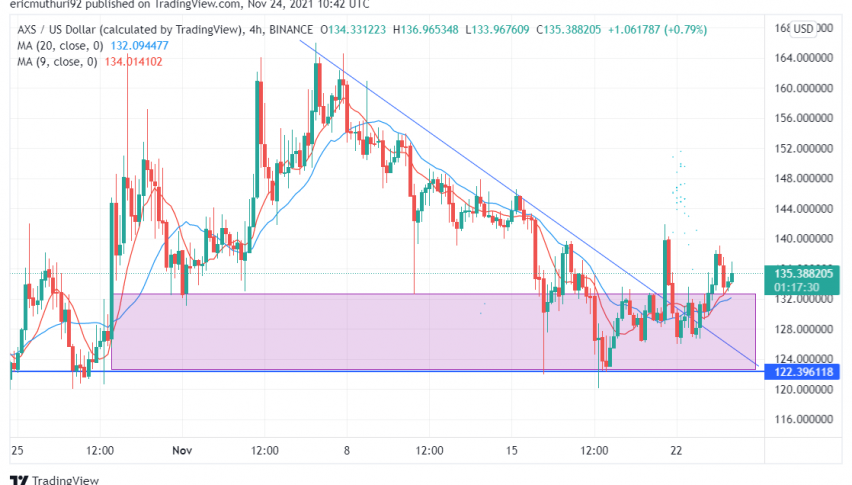
Now, AXS/USD is showing bullish signs, with a break above a descending trendline pointing to a further uptick in price.
– A 4-Hour Technical Outlook

From the 4-hour chart above, we can see that AXS/USD broke above the descending trendline, which formed a descending triangle with the established support at $122. A break above the descending trendline confirms a potential price reversal, with the token now consolidating in a buoyant mode above the support.
What Next For AXS/USD?
I expect AXS/USD to rebound after failing to breach the support of $122 and breaking above the ascending trendline. Further confirmation of the bullish momentum is shown by the 9-moving average (red) and 20 moving averages (red). Both moving averages are below the current price which supports a bullish momentum in the short-term and medium-term.
Given the strong bullish view, I recommend a buy on AXS/USD at the current level or after a short retrace to the moving averages as long as prices maintain above the $122 support. For buy trades, realistic targets can be set at $142, $150, and potentially higher, up to $160.
Fantom (FTM/USD) Breaks above a Key Level. Can It Sustain the Momentum?
Fantom (FTM/USD) came under a bearish momentum on November 8, when it fell from a high of $3.15 to breach the $1.95 support on November 18, dropping to $1.79 on November 21. The pair reversed the trend but got resisted at $2.25 on November 20, forcing it to retest $1.95 support on November 22. FTM/USD surged from the support level but was resisted at $2.3.
Can FTM/USD sustain the bullish momentum, or will we see a retrace? Let us look at the technical analysis.
4- Hour Technical Outlook
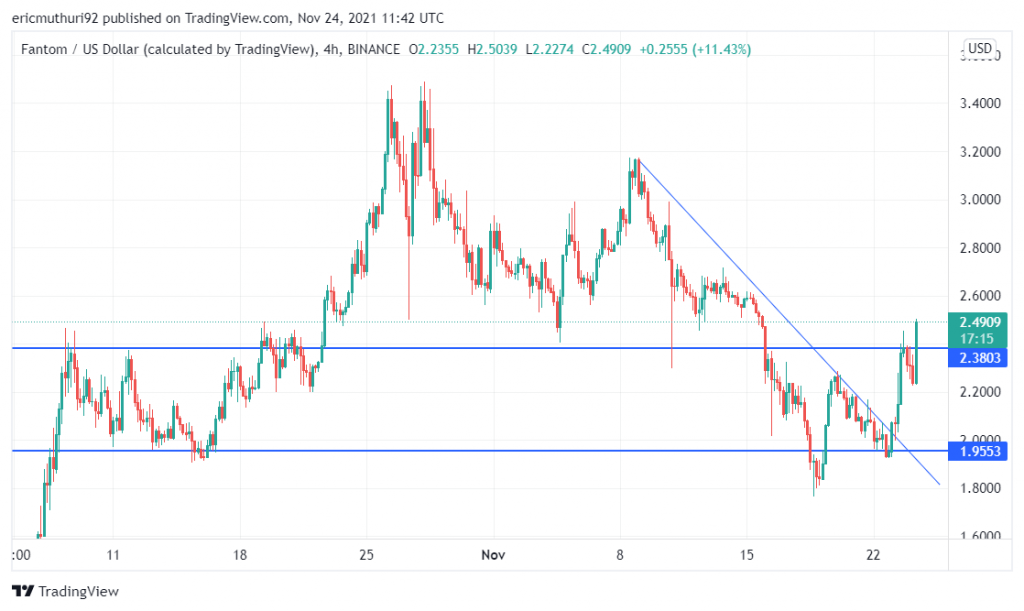
Looking at the 4 Hour chart above, FTM/USD has violated the descending trendline and has briefly pierced the $2.3 resistance in a bullish momentum characterized by higher highs and higher lows.
FTM/USD Trade Idea
We are bullish on FTM/USD in the near term to medium term as it attempts to break above the $2.3 level. The $2.3 level was acting as resistance before, and a break above it confirms a bullish momentum. We recommend a buy trade at the current level setting $2.6 as our immediate profit target. Other potential targets are $3.1 or even the all-time high of $3.5. Happy trading!
- Check out our free forex signals
- Follow the top economic events on FX Leaders economic calendar
- Trade better, discover more Forex Trading Strategies
- Open a FREE Trading Account
- Read our latest reviews on: Avatrade, Exness, HFM and XM
Related Articles


Sidebar rates
Related Posts
