Is Solana (SOL/USD) About to Become Bullish? Signals Form at Key Level
After remaining on a bearish momentum since the first week of November, Solana's native token SOL is now showing bullish signs.
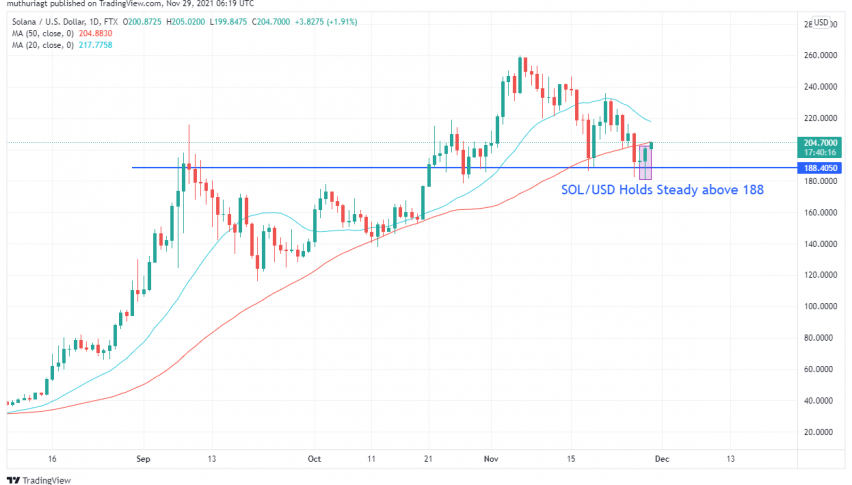
After remaining on a bearish momentum since the first week of November, Solana’s native token SOL is now showing bullish signs. The token touched the established support of 188 on November 18 and attempted to jump higher before finding resistance again. A crypto rout on November 26 due to renewed concerns of a new coronavirus strain pushed SOL/USD further down to the support zone of 188, breached it briefly but closed higher. Now, SOL/USD seems to have overcome recent weak weaknesses after remaining steady at 188 as it prepares for a bullish takeoff.
– A Daily Chart Technical Outlook
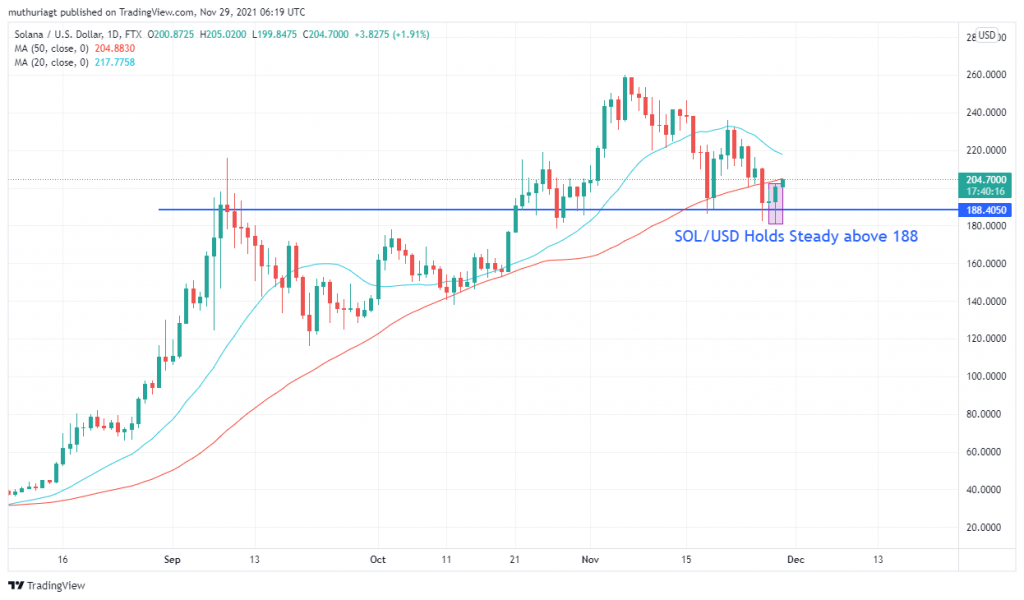
A daily chart of SOL/USD shows that 188 is a strong support level as prices tested it several times. It acted as resistance before prices pierced through it in a bullish momentum that led to fresh all-time highs. After holding strong in a bearish market that lasted for three weeks, the 188 support is now pushing Solana higher.
A bullish price signal can be observed at the support level, which is already taking SOL/USD higher, with the 24-hour gains reaching 8.14%, despite the token having slipped by almost 7% in the last seven days. Nonetheless, the pair trades below the 20 moving average (blue) and the 50 moving average (red). From the daily chart outlook, the two moving averages could offer temporary resistance before we see a strong and lasting bullish momentum. But, moving averages get a little bit juicier if we switch to the 4-hour chart:
– A 4-Hour Chart Technical Outlook
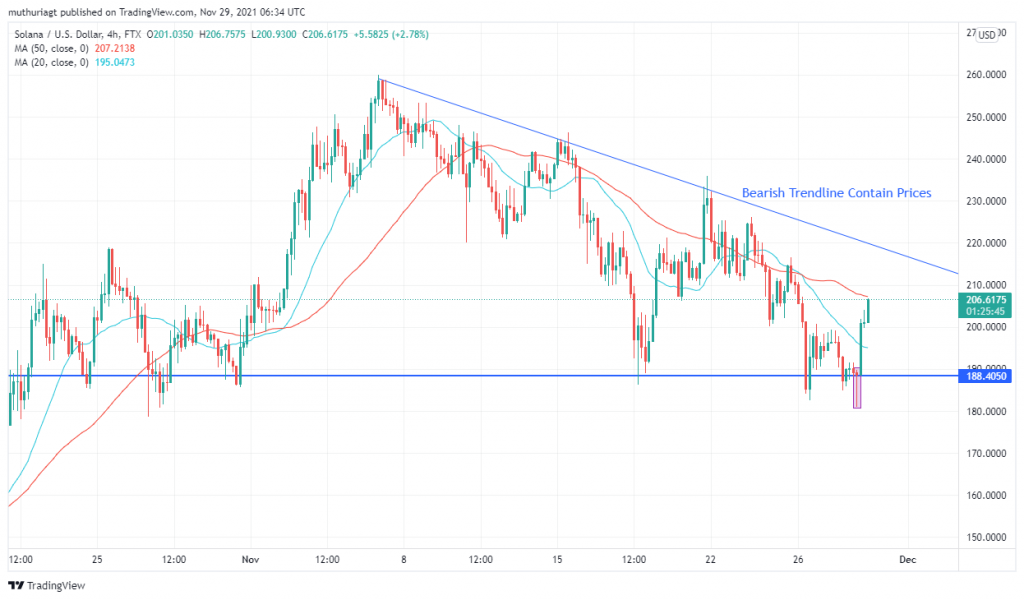
SOL/USD reveals further bullish signs when looked at on the 4-hour chart. A bullish pin bar can be observed at the support level and is already pushing the token up. However, unlike the daily chart where all moving averages provided resistance, the 20 moving average is now below the current price and offering support. The 50 moving average is still above the current price, but looks likely to join support, which points to a potential short-term consolidation.
Besides, looking at the 4-hour chart, it must clear another hurdle – breaking above the bearish trendline. At the current price, Solana is below a trendline which could keep it low until it breaks above.
SOL/USD Trade Analysis and Idea
There are mixed signals on SOL/USD trading given that moving averages continue to resist price on the daily chart, and only one joins on the 4-hour chart. Also, the bearish trendline could keep buyers out in the meantime. But does that mean Solana buy is a bad idea?
The technical indicators suggest that the bearish move on SOL/USD is now almost over. Multiple price action trading signals at established support of 188 points to a bullish reversal. I insist that we could see some days of price consolidation before it breaks above the moving averages and descending trendline. When this happens, the pair could reclaim higher levels of up to 258, which will become our buy targets.
For now, we need to find a perfect entry point for SOL/USD, which can occur upon a price break above the moving averages and/or descending trendline as long as the 188 support continues to hold. Good luck!
- Check out our free forex signals
- Follow the top economic events on FX Leaders economic calendar
- Trade better, discover more Forex Trading Strategies
- Open a FREE Trading Account
- Read our latest reviews on: Avatrade, Exness, HFM and XM
Related Articles


Sidebar rates
Related Posts
