Bitcoin Repaints $50K – Why 61.8% Fibonacci is a Key for Uptrend Continuation
Bitcoin is regaining ground and trading above $50,000 against the US dollar. ETH must settle above $51,000 and the 100
Written by:
Arslan Butt
•
Tuesday, December 7, 2021
•
2 min read
•
Last updated: Tuesday, December 7, 2021
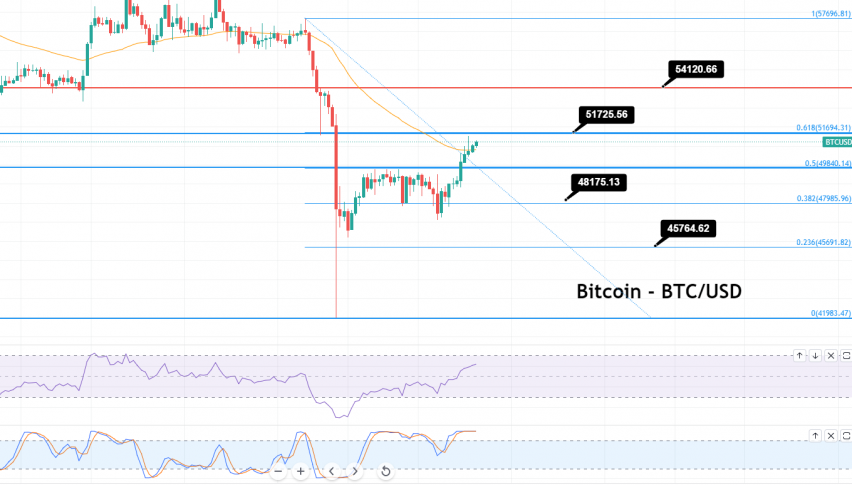
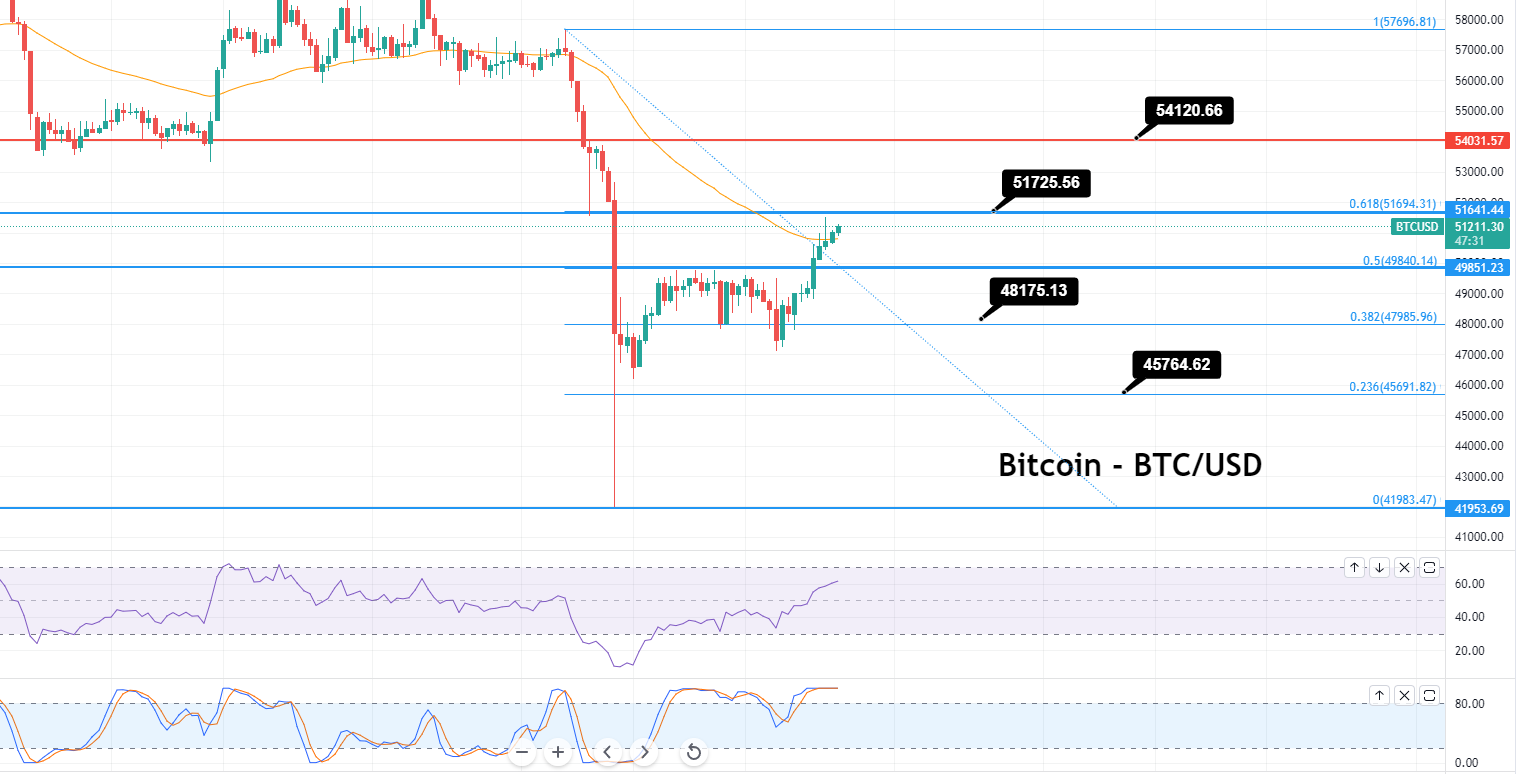
Bitcoin is regaining ground and trading above $50,000 against the US dollar.
ETH must settle above $51,000 and the 100 hourly SMA, if it is to go upward. Bitcoin has begun a comeback wave above the critical $50,000 resistance zone. The price is currently close to $51,000 and the 100 hourly simple moving average.
Bitcoin Live Rate
On the hourly timeframe for the
BTC/USD pair, a short-term bullish trend line is forming, with support near $49,600. It might begin a decent upward surge if the pair closes above $51,000.
The Bitcoin price is gaining momentum
Following a significant drop below $45,000, the Bitcoin price has begun a decent comeback wave. The recent rebound began with BTC rising back over the resistance levels at $46,500 and $48,000.
The price has now returned to above the $49,200 resistance mark, after a break over the crucial 50 percent Fib retracement level slide, from the swing high of $57,690 to the low of $40,150. Furthermore, the bulls were able to drive the price above the critical $50,000 barrier.
A short-term bullish trend line is forming on the hourly timeframe of the BTC/USD pair, with support near the $49,600 level. The pair is currently trading close to $51,000 and the 100-hourly simple moving average.
On the higher side, there is an immediate barrier near the $51,000 level and the 100 hourly SMA, close to the 61.8 percent Fib retracement level of the crucial slide from the swing high of $57,690 to the low of $40,150. A decisive break above the $51,000 resistance level could enable more gains.
The next major obstacle is near $52,500, above which the price could move higher. In the scenario above, the price could jump to $53,500.

Is a New Drop in BTC Likely?
If Bitcoin fails to break through the $51,000 barrier mark, it may trigger a new bearish bias. Towards the lower side, there is immediate support near the $50,200 level.
The first ample support is currently emerging near the $49,600 mark and the trend line. A breach below the $49,600 support level might signal the start of a new slump. The next target for the bears could be $46,000.
Arslan Butt
Lead Markets Analyst – Multi-Asset (FX, Commodities, Crypto)
Arslan Butt serves as the Lead Commodities and Indices Analyst, bringing a wealth of expertise to the field. With an MBA in Behavioral Finance and active progress towards a Ph.D., Arslan possesses a deep understanding of market dynamics.
His professional journey includes a significant role as a senior analyst at a leading brokerage firm, complementing his extensive experience as a market analyst and day trader. Adept in educating others, Arslan has a commendable track record as an instructor and public speaker.
His incisive analyses, particularly within the realms of cryptocurrency and forex markets, are showcased across esteemed financial publications such as ForexCrunch, InsideBitcoins, and EconomyWatch, solidifying his reputation in the financial community.
Related Articles