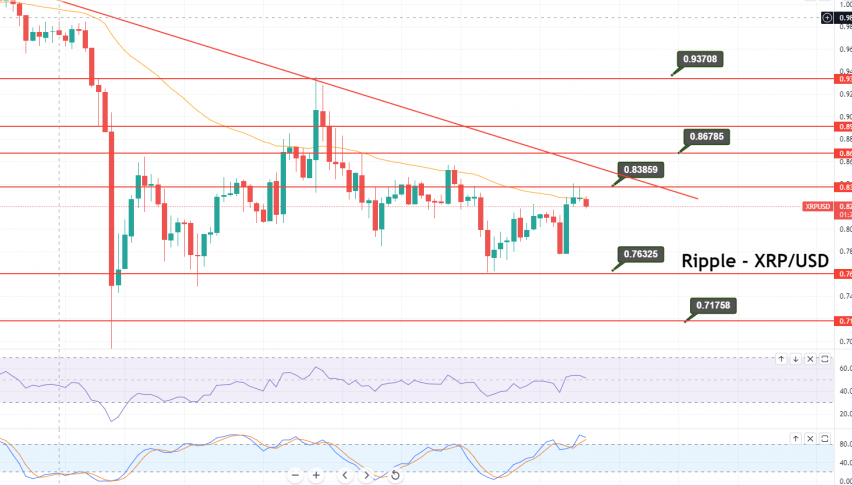
Ripple (XRP) Repaints $0.8370 – 50 SMA Pushes it Lower
Ripple closed at $0.82597 after placing a high of $0.83947 and a low of $0.77758. XRP/USD surged for another day, but the price movement
•
Last updated: Thursday, December 16, 2021
- Ripple is one of the top 10 cryptos highly influenced by the big movers and shakers in the crypto world like BTC.
- The XRP/USD coin faces strong resistance at 0.8230, which is being extended by a 50 SMA line.
- The US central bank has provided many hints that it could increase interest rates three times in the upcoming year for the first time since 2018
Ripple Live Rate
XRP/USD

Daily Technical Levels
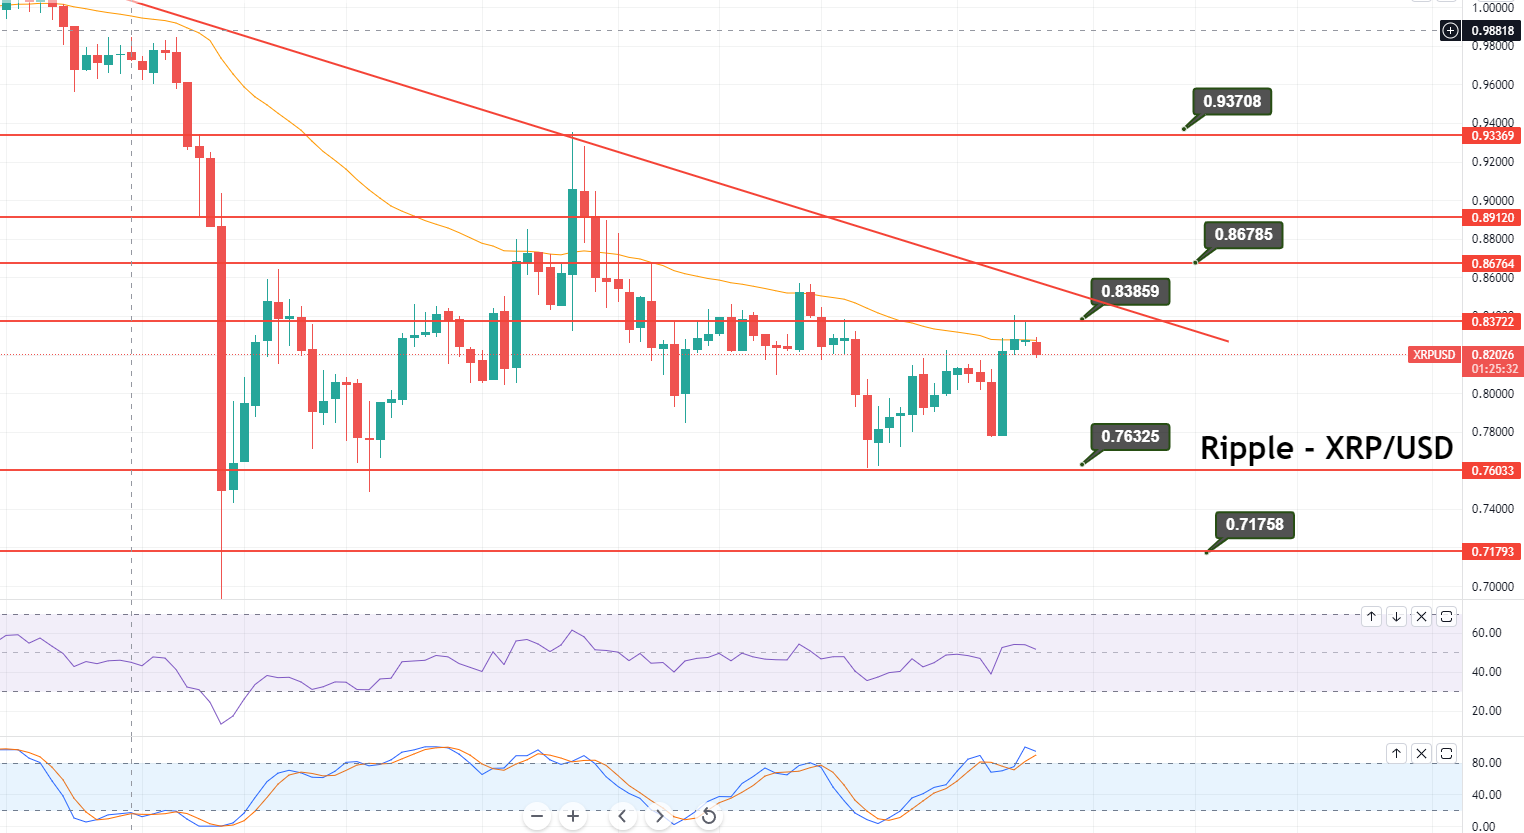
Ripple Technical Outlook – Selling Bias Dominates Under 50 SMA
- Check out our free forex signals
- Follow the top economic events on FX Leaders economic calendar
- Trade better, discover more Forex Trading Strategies
- Open a FREE Trading Account
- Read our latest reviews on: Avatrade, Exness, HFM and XM
ABOUT THE AUTHOR
See More
Arslan Ali Butt
Lead Markets Analyst – Multi-Asset (FX, Commodities, Crypto)
Arslan Ali Butt serves as the Lead Commodities and Indices Analyst, bringing a wealth of expertise to the field. With an MBA in Behavioral Finance and active progress towards a Ph.D., Arslan possesses a deep understanding of market dynamics.
His professional journey includes a significant role as a senior analyst at a leading brokerage firm, complementing his extensive experience as a market analyst and day trader. Adept in educating others, Arslan has a commendable track record as an instructor and public speaker.
His incisive analyses, particularly within the realms of cryptocurrency and forex markets, are showcased across esteemed financial publications such as ForexCrunch, InsideBitcoins, and EconomyWatch, solidifying his reputation in the financial community.
Related Articles

Sidebar rates
Related Posts
