Ripple (XRP) Steady Below $0.9175 – Why it’s Crucial to Break Over $0.9500
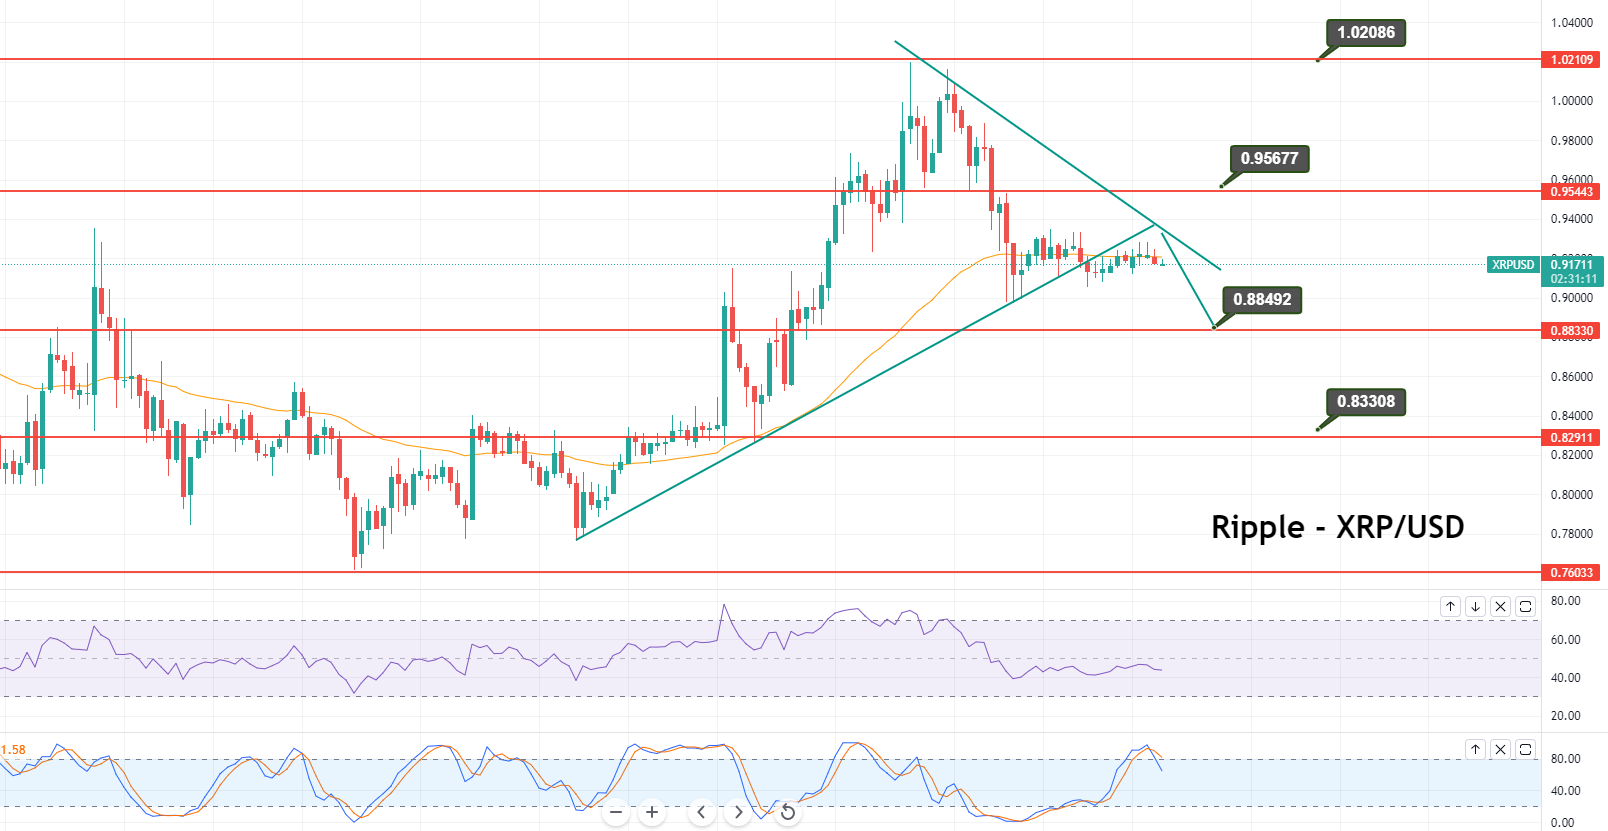
The XRP/USD pair ended the day at $0.92043, having reached a high of $0.93411 and a low of $0.90619. Ripple's crypto continued its flat
- Shark Tank star Kevin O’Leary has about 10% of his total investment in cryptocurrencies, and he has decided not to bet his money on one coin, which is Ripple’s token XRP.
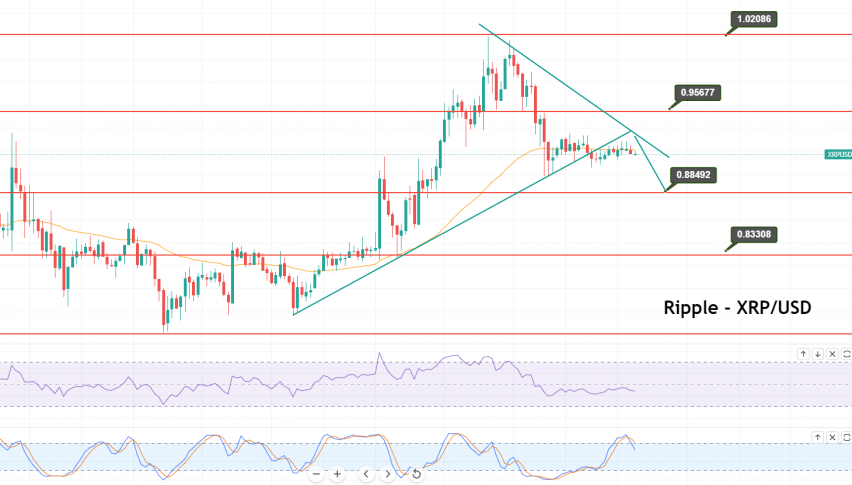
- The XRP/USD pair is trading at 0.9166 level, facing strong resistance at 0.9175. On the 2-hour timeframe, the SMA is likely to provide resistance at the 0.9175 level.
- The SEC filed charges against Ripple and its two executives last year, and the case has not yet been resolved in favor of any party.
Ripple Live Rate
The TV star has about 10% of his total investment in cryptocurrencies, and he has decided not to bet his money on one coin, which is Ripple’s token XRP. The SEC filed charges against Ripple and its two executives last year, and the case has not yet been resolved in favor of any party. However, a couple of weeks ago, Ripple has enjoyed a bullish rally a another non-profit organization named Empower Oversight filed a case against the SEC for being biased against Ripple and sparing other cryptos like Ethereum. The filing of this case brought a spark of bullish momentum in XRP/USD prices; however, the comments from Kevin O’Leary in such a situation capped further gains and turned the crypto flat for the day.
Meanwhile, the US dollar was also subdued due to the holiday season and the absence of investors, which also kept the cryptocurrency XRP flat. It looked like investors were out of the market, which caused consolidated movement throughout.
Daily Technical Levels
Ripple Technical Outlook – XRP Retest $0.9175
- Check out our free forex signals
- Follow the top economic events on FX Leaders economic calendar
- Trade better, discover more Forex Trading Strategies
- Open a FREE Trading Account
- Read our latest reviews on: Avatrade, Exness, HFM and XM
Related Articles
Sidebar rates
Related Posts
