Binance (BNB) Price Analysis: Signs of Recovery as Bulls Defend Key Support Levels
Cryptocurrency markets are showing alleviated selling pressure from bears in the past weeks, but it is still unclear whether the overall market correction has ended.
Major Support Levels Broken
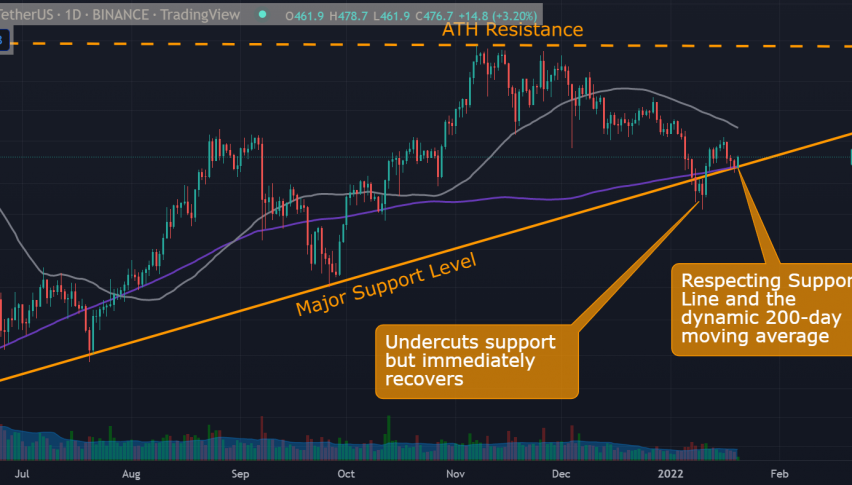
Recently, Binance (BNB) has been showing signs that it could bottom. It initially sold off in an extreme fashion when it broke down below its 200-day moving average (purple line) and its major uptrend line support level from 2021. These were key support levels that, if broken, meant more potential corrections and a continued bearish sentiment for BNB.
First Bullish Signal – Strong Undercut Bounce
However, when it broke down these two major support levels it immediately rebounded with strength and volume. This type of price action could be interpreted as a possible dead-cat bounce or a simple short-term rally, which is just a knee-jerk reaction to the oversold nature of BNB. Nonetheless, this type of rally is still an initial positive bullish sign, which is welcomed by the bulls, as the price undercut the major support levels everyone was looking at, and then it reversed immediately, to rally 25% from the low of $405.60 to a high of $506 in a few days.
Bearish Bias Prevails
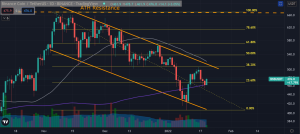
Looking at BNB from a much closer perspective, we see that it is still inside a downward channel, despite the recent recovery rally. This means the overall bias for BNB is still bearish. Until this downward channel is broken, or until it rallies to $540, BNB’s bearish sentiment will remain.
Potential 2nd Bullish Signal: 23.6% Fib and 200-day MA Support Levels Respected
Today’s green bounce is a potentially bullish signal if BNB continues to rally above the 200-day moving average (purple line). This would create a higher low with the 23.60% Fib. and the 200-d MA as support. This strengthens the short-term bullish case for BNB. The final bullish signal needed to confirm that it has indeed bottomed, would be to be able to break above the aforementioned downward channel.
Key Levels to Watch:
- $460-470 Support: 23.6% Fib. and 200-day MA support, potential higher low if the rally continues. Watch out if it falls back below 460, as this could mean another leg down for BNB.
- $500-520 Resistance: $500 is a major psychological resistance level. While the $500-520 range coincides as the upper limit of the downward channel and the 38.20% Fib. level. A rally above this could mean a high probability that BNB has bottomed and that it could now consolidate or rally even higher.
For now, it would be best to stay away from the market and watch how prices react at these critical levels before assessing whether to buy or sell Binance (BNB).
- Check out our free forex signals
- Follow the top economic events on FX Leaders economic calendar
- Trade better, discover more Forex Trading Strategies
- Open a FREE Trading Account
- Read our latest reviews on: Avatrade, Exness, HFM and XM
Related Articles


Sidebar rates
Related Posts
