Can Polkadot (DOT) Break Past Resistance And Head to $25?
Polkadot (DOT) is trending higher after posting strong gains over the past week, with buyers making the most of the bullish sentiment that

Polkadot (DOT) is trending higher after posting strong gains over the past week, with buyers making the most of the bullish sentiment that has returned to the crypto market following Bitcoin’s rebound. At the time of writing, DOT/USD is trading at around $22.07.
One of the most exciting developments boosting investor confidence in the DOT token is a report from Crypto Carbon Ratings Institute (CCRI), which reveals that Polkadot consumes the lowest levels of energy among leading blockchain networks. The interoperability focused network consumes 6.6 times the electricity used by an average US household, in comparison with ETH and BTC for which the figure jumps up to 1.6 million and 8.6 million respectively.
This news can give many investors reason to cheer as one of the biggest concerns weighing on the mainstream adoption of crypto and blockchain technology is its energy intensive process. At a time when sustainability and responsibility towards the environment are fast becoming key drivers in making business decisions, Polkadot’s energy efficient yet versatile infrastructure can encourage more Web3 development and adoption.
The DOT crypto receives additional support from Crypto.com launching Polkadot deposits and withdrawals on its ecosystem via the Cronos chain. As one of the leading crypto exchanges, the move will allow more users of Crypto.com to invest in DOT via its mobile app.
Meanwhile, the release of the Polkadot Pioneers Prize can encourage higher levels of activity among developers on the blockchain in the near future. The bounty proposal will see the blockchain set aside $21 million worth of DOT from its on-chain treasury towards fostering the development of Web3 applications in its ecosystem.
DOT/USD Technical Analysis
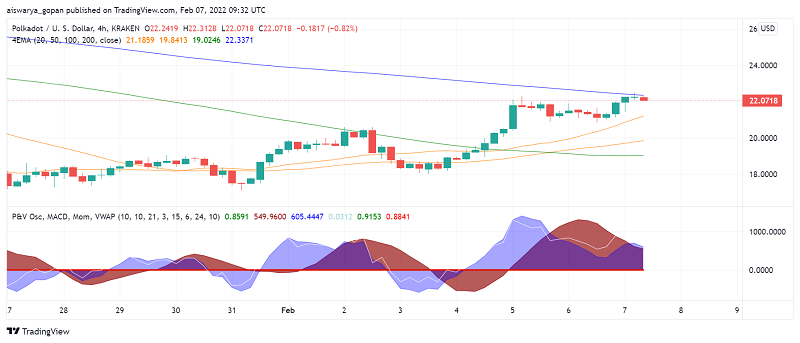
Technical analysis of the 4-hour chart of DOT/USD shows a strong bullish bias among almost all moving averages and leading technical indicators MACD and momentum. Although, the 200 EMA (blue) still points to some interest among sellers.
Polkadot is trading above the pivot point at $20.44 but buyers are yet to crack the resistance at $23.78. Let’s see if some pressure can build up to take DOT past this level in the near term.
- Check out our free forex signals
- Follow the top economic events on FX Leaders economic calendar
- Trade better, discover more Forex Trading Strategies
- Open a FREE Trading Account


