USD/JPY Slips Below 128: What Will be The Next Target?
In the last quarter, we have observed a remarkable surge in demand for the Japanese Yen.
In the last quarter, we have observed a remarkable surge in the demand for the Japanese Yen. Nevertheless, the change was partly in response to a major bearish (or bullish if we are looking at pairs such as USD/JPY ) trend as well as by the softening of certain exchange rates.
There are multiple factors that have traditionally affected the Yen’s value in the market. However, its role as a ‘funding currency’ in international carry trade activities has had the greatest impact on its fluctuating performance over time. Despite the significant increases in rates over the last year, there are now viable investing opportunities with a reasonable yield.
Despite offering a steady return, a volatile exchange rate can easily undo the advantage if market conditions change. This is exactly what happened in the last three months when USD/JPY saw a sharp plunge of almost 16% from its October 21st intraday-high.
Interestingly, investors seem to be more willing to take on risk at the moment which would support the carry trade. However, the stagnation of rate forecasts from entities such as Bank Of Japan has been mitigating that potential pressure.
USD/JPY Technical Outlook
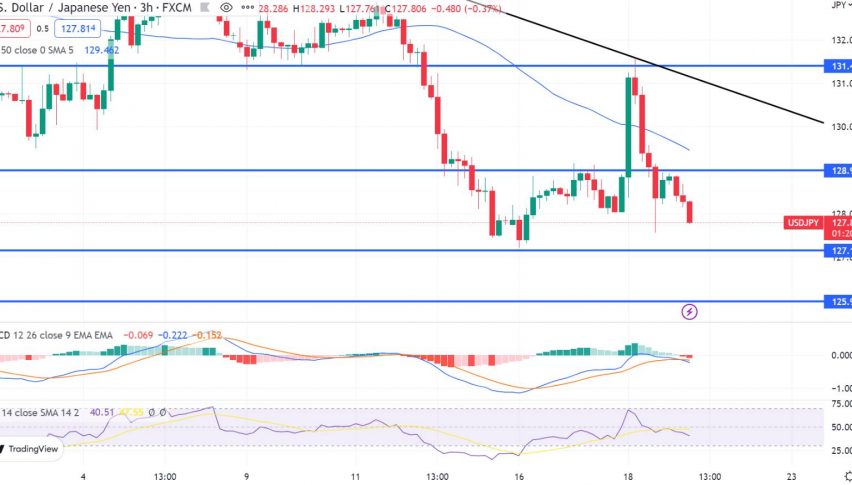
The USD/JPY price has gone up slightly from where it closed yesterday, at 128.14. It is now trading at 128.30. The Bank of Japan’s decision to remain consistent on rates, policy and forecasts caused a significant spike in the market. The market is still looking to strengthen the JPY despite what has been an unpredictable journey.
Prices of the pair dropped below its 100 hour moving average at 128.699, thereby making the bias more negative. In fact, the day’s low was recorded at 127.56, indicating a bearish outlook. The current price is higher than the Monday low of 127.21, however if it drops and stays below that number then the bearish bias would grow.
According to the weekly chart, the 50% midpoint of the uptrend from May 22, 2022 stands at 126.554 and a low from that week stands at 126.348. If there is more selling pressure and price falls below 127.21 then these two levels can be potential targets on the downside.
- Check out our free forex signals
- Follow the top economic events on FX Leaders economic calendar
- Trade better, discover more Forex Trading Strategies
- Open a FREE Trading Account


