Forex Signals Brief July 10: Focus Shifts to US Inflation Figures as Market Awaits FOMC Meeting

Yesterday’s Market Wrap
The release of the Nonfarm Payrolls data on Friday revealed an increase of 209,000 jobs in June, falling short of expectations for the first time in 15 months. However, despite the slowdown, positive signs in the labor market have raised expectations of a 25 basis point interest rate hike by the Federal Reserve (Fed) during their July meeting.
The US Dollar Index experienced a significant drop on Friday following the Nonfarm Payrolls data, ending the week substantially lower at around 102.25 after being rejected from above 103.00.
Despite higher US yields, the US Dollar struggled to gain momentum. The 10-year yield surpassed 4.00% for the first time since March and is currently holding above that level.
Today’s Market Expectations
Next week, market attention will be focused on the release of US inflation numbers, which will be closely monitored in anticipation of the upcoming July 25-26 FOMC meeting. Additionally, China is scheduled to announce its inflation data, while the UK will unveil employment figures on Tuesday.
Furthermore, the Reserve Bank of New Zealand and the Bank of Canada will make their respective announcements on Wednesday, adding to the recent developments in central bank policies.
Looking ahead to next week, the primary focus will be on the US inflation figures, which will have a significant impact on the expectations of a potential interest rate hike by the Federal Reserve (Fed).
The June Consumer Price Index (CPI) is scheduled to be released on Wednesday, followed by the Producer Price Index (PPI) on Thursday.
The CPI is projected to show a monthly rise of 0.3%, with the annual rate expected to decline from 4.0% to 3.1%. The Core CPI excludes volatile food and energy prices and is predicted to fall from 5.3% to 5.0%.
Forex Signals Update
Yesterday’s market saw a mix of slow price action and moments of heightened volatility, particularly when the US economic data was released. The release of the US Nonfarm Payrolls (NFP) figures triggered increased market activity and had a notable impact on our trading positions.
Unfortunately, the market moved against us with the NZD/USD, USOil, and USD/JPY trades, resulting in losses. However, it’s important to note that our long-term signals for GBP/USD and EUR/USD closed in profit, providing some positive outcomes amid the volatility.
Overall, the market’s reaction to the NFP figures created a challenging trading environment. We continue to closely monitor the market conditions and make informed decisions based on our analysis and strategy.
GOLD Struggles Under $1,930
Gold continues to face challenges near the $1,930 level, unable to break above it. Currently, the price of Gold is trading near $1,925, showing resistance in its upward movement. Despite the recent attempts to rally, Gold has been unable to sustain momentum.
Looking ahead, the next target for Gold appears to be around the $1,915 level. However, we recommend waiting for our comprehensive price analysis on Gold, which will provide a more detailed outlook and insights into the market dynamics.
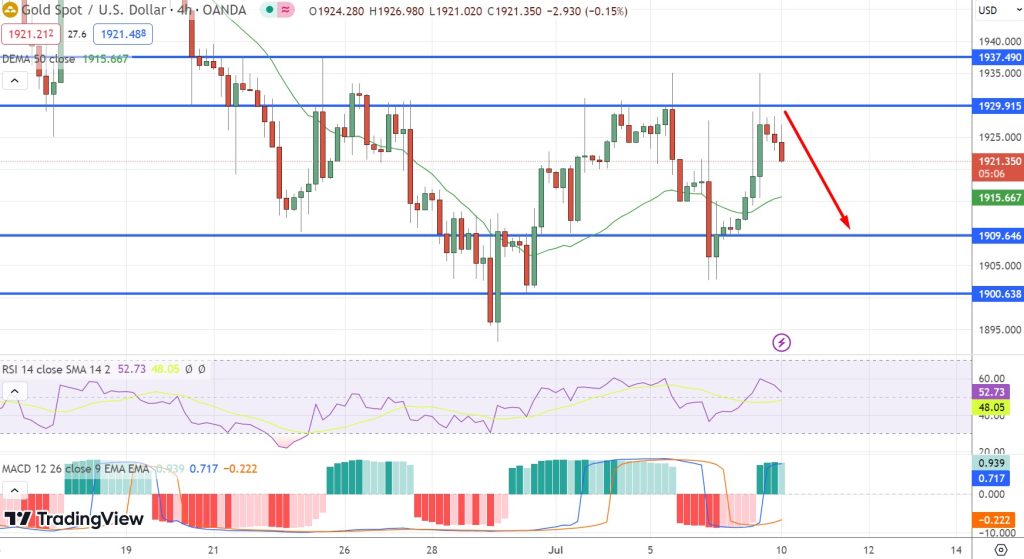
XAU/USD – 240 minute chart
AUD/USD Double Top Resistance Near 0.6699
The Australian dollar is currently encountering a key resistance level of around 0.6699, further supported by the formation of a double top pattern visible on the 3-hourly time frame below. If candles close below this level, it could potentially lead to a limited downward continuation.
As such, the suggested approach for today is to consider a short position below this level, with potential targets at 0.6650 or 0.6618.
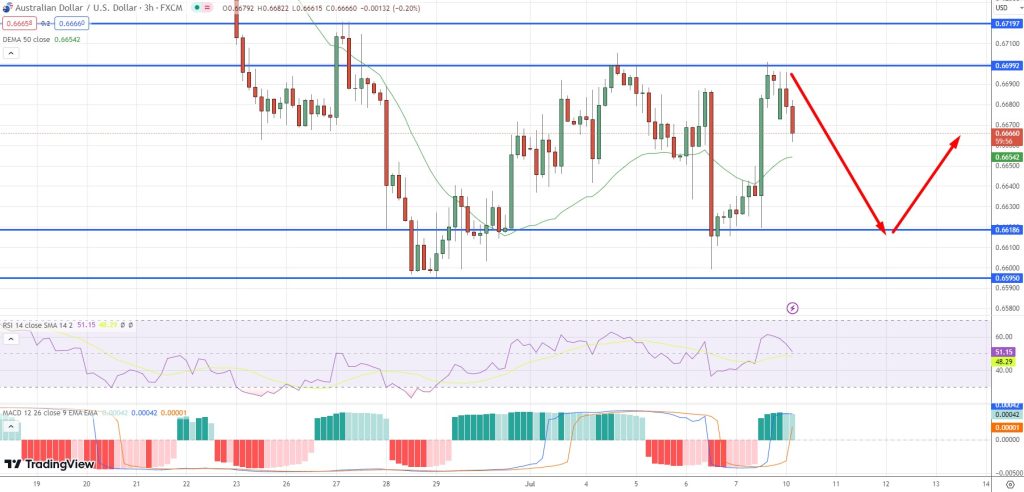
AUD/USD – 240 minute chart
Cryptocurrency Update
BITCOIN Remains Within the Range
Bitcoin has been consolidating within a range of approximately $31,000 to $31,500 following a period of bullish sentiment in the cryptocurrency market, which led to a surge in June.
Yesterday, BTC/USD reached a new yearly high above $31,500 but struggled to sustain the gains and experienced a reversal. Nonetheless, Bitcoin continues to remain within the established range.
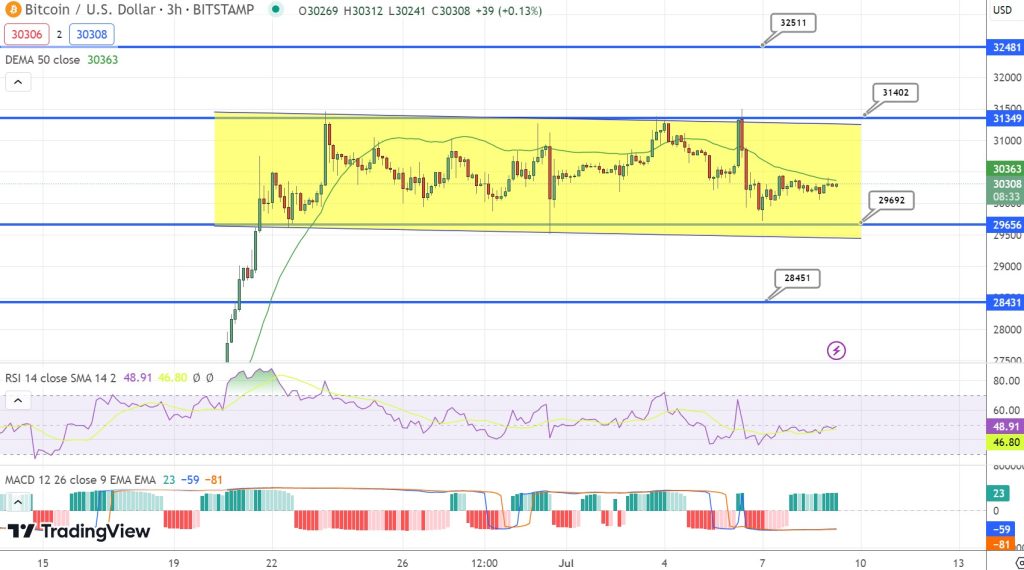
BTC/USD – 240 minute chart
Will the 100 Daily SMA Hold As Support for ETHEREUM?
In the middle of the previous month, there was a significant surge in cryptocurrencies, with the ETH/USD pair surpassing the $1,900 mark. However, it fell short of reaching our predetermined take-profit target and began to retrace its gains.
After a period of consolidation, the price started to decline. Initially, the 50-day Simple Moving Average (SMA) provided support, but eventually, it was breached.
Fortunately, the decline found support at the 200-day SMA, resulting in a bounce above all moving averages. Currently, we are witnessing a pullback, and it remains to be seen if the 100 SMA will hold as a support level.
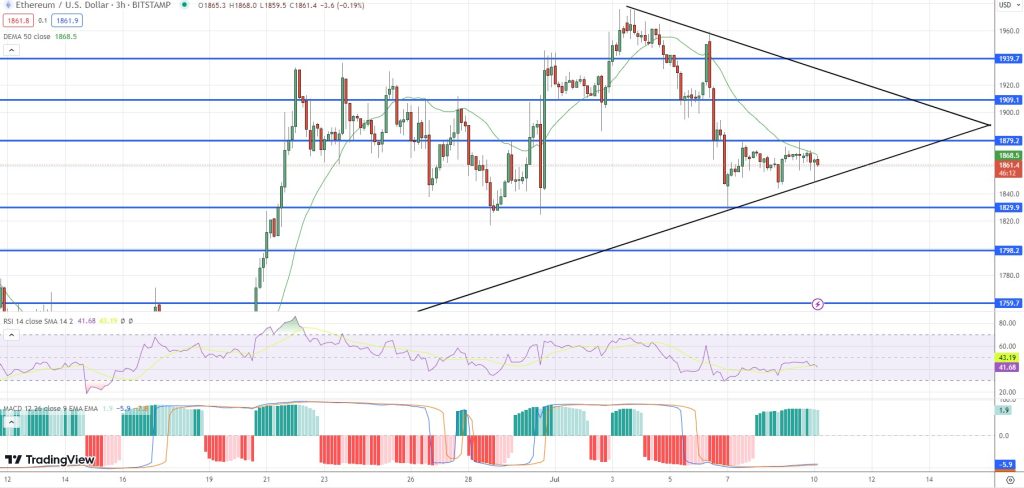
ETH/USD – Daily chart
- Check out our free forex signals
- Follow the top economic events on FX Leaders economic calendar
- Trade better, discover more Forex Trading Strategies
- Open a FREE Trading Account
