USD/CAD Technical Analysis: Assessing USD/CAD’s stiff resistance at 1.3200
The technical analysis of the USD/CAD pair suggests a prevailing bearish sentiment with immediate resistance and key moving averages acting as significant hurdles. Let’s break down the information provided and interpret it to gain insights into the potential future direction of the USD/CAD currency pair.
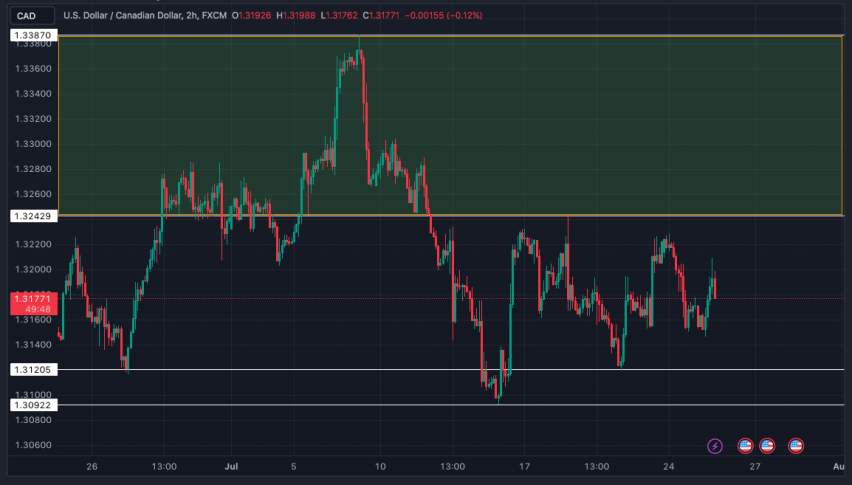
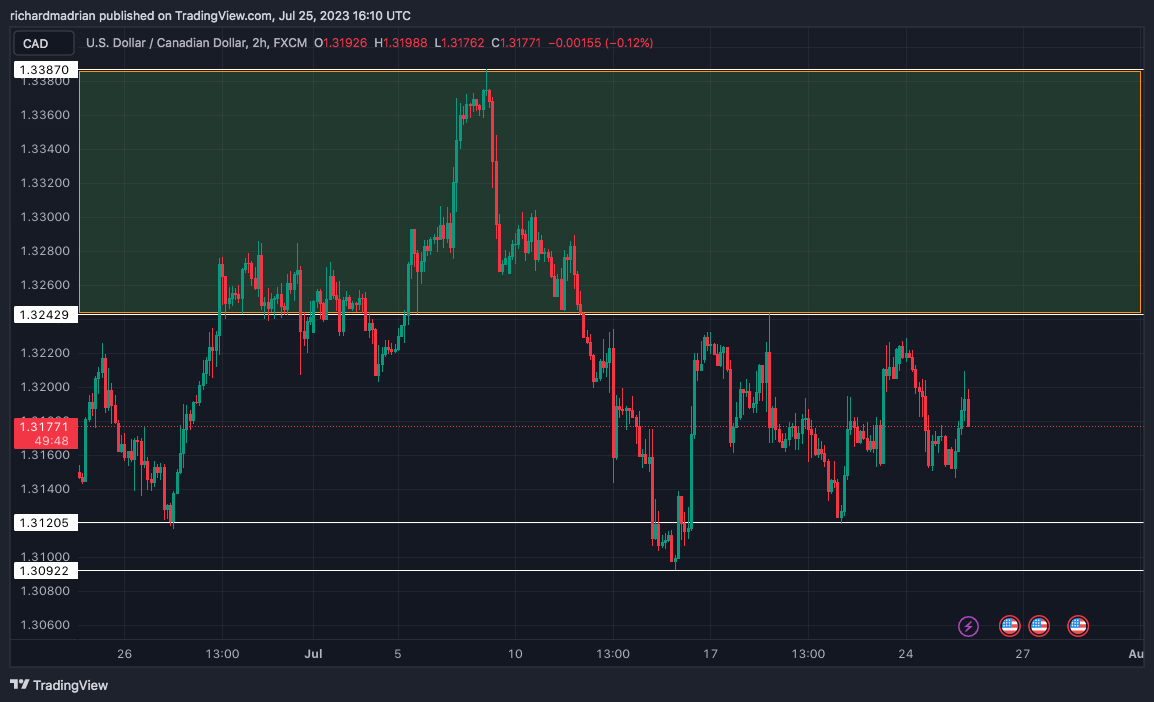
The first piece of information indicates that there is a notable resistance level at 1.3200. This means that the pair has struggled to move above this price point recently, potentially acting as a barrier to further upward movement.
The daily chart shows a recent intraday low at 1.3146. This suggests that the USD/CAD has been testing lower levels, and this price point could be a critical support zone.
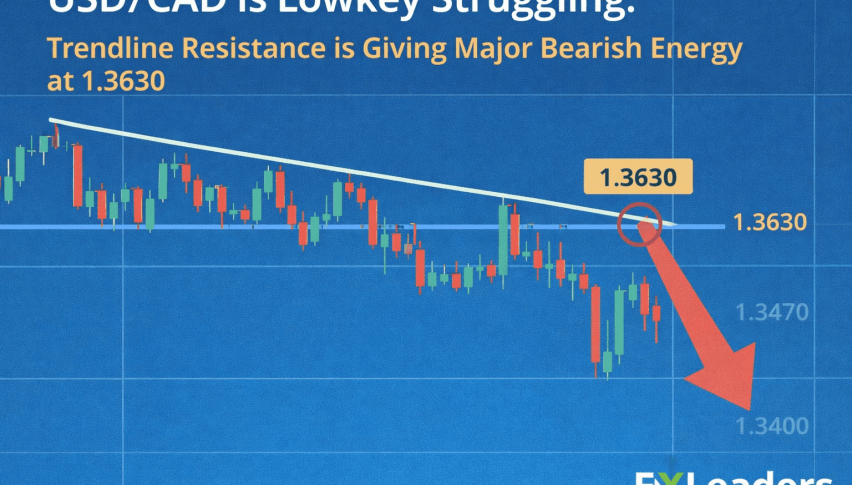
The analysis points out that red candles dominate the 2-week chart, indicating a consistent downtrend during that period. Thereby suggesting that the bearish sentiment adds weight to the argument for further downside potential in the USD/CAD pair.
Moving Averages
The 50-day EMA, located at 1.3293 implies that the price might find it challenging to sustain an upward movement above this level. The 20-day EMA at 1.3214 could also offer resistance and act as a minor hurdle in the short term.
Both the weekly low and the intraday low are at the same price level, 1.3146. This level becomes even more significant as it represents a strong support zone. If the pair breaks below this level convincingly, it could trigger further bearish momentum.
The provided data presents a mix of indicators and oscillators. The majority of indicators (13) are signalling a sell, indicating a bearish sentiment. On the other hand, oscillators are more mixed, with 8 neutral readings and 2 buy signals, but still leaning toward a bearish bias. This disparity suggests that while some momentum indicators are showing weakness, traders should exercise caution as the market sentiment might not be entirely one-sided.
The moving averages are predominantly bearish, with 12 indicating a sell, 1 neutral, and only 1 buy. This aligns with the overall analysis and emphasizes the downward bias of the pair.
The current price is hovering around the 10-period EMA at 1.3192, which is close to the immediate hurdle at 1.3200. This proximity further reinforces the significance of the 1.3200 resistance level.
Conclusion
In conclusion, the technical analysis of the USD/CAD pair points to a bearish outlook. The 2-week chart shows a consistent downtrend, supported by the majority of indicators signalling a sell. The immediate hurdle at 1.3200 and the 50-day EMA at 1.3293 act as strong resistance levels. On the downside, the weekly low and intraday low at 1.3146 represent critical support.
Traders and investors should closely monitor the price action around the 1.3200 level. A convincing break above this level might signal a potential reversal of the downtrend. Conversely, if the pair breaks below the 1.3146 support decisively, it could lead to further bearish momentum with potential targets around the 1.3100 and 1.3000 psychological levels.
- Check out our free forex signals
- Follow the top economic events on FX Leaders economic calendar
- Trade better, discover more Forex Trading Strategies
- Open a FREE Trading Account
- Read our latest reviews on: Avatrade, Exness, HFM and XM
Related Articles


Sidebar rates
Related Posts
