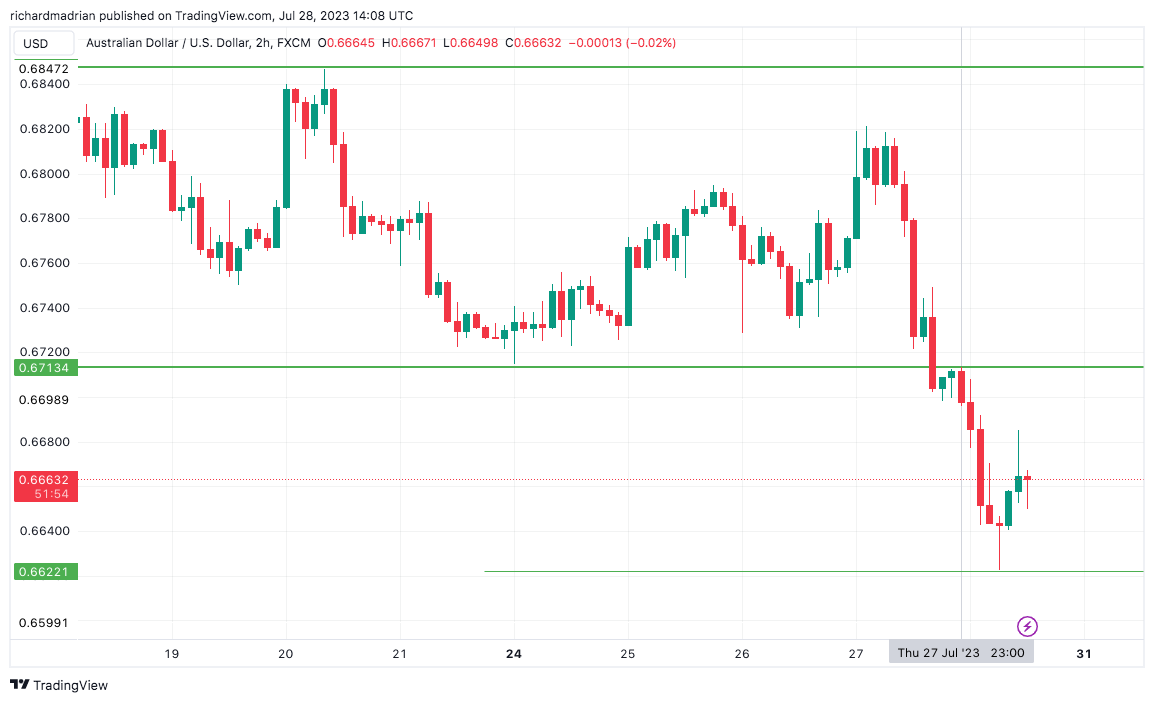
Australian dollar still tracing downwards after the US Q2 GDP report
If the AUD/USD exchange rate manages to surpass this key hurdle, it could signal a shift in the outlook from sideways to a more bullish trend in the longer term.
The Australian Dollar (AUD) faced significant downward pressure against the US Dollar (USD) on Friday, primarily driven by a series of factors. Firstly, the release of better-than-expected US GDP data for the second quarter on Thursday has bolstered the strength of the US Dollar. This positive economic data likely indicates a robust economic recovery in the US, which can lead to increased investor confidence in the USD and capital flows towards the US economy.
Secondly, the Federal Reserve’s preferred inflation gauge, Personal Consumption Expenditure (PCE), unexpectedly rose on a month-on-month basis. This increase in inflation indicates potential concerns about rising prices and may prompt the Federal Reserve to consider tightening its monetary policy to control inflation. As a result, investors may shift their investments towards the USD in anticipation of higher interest rates, making the Australian Dollar less attractive in comparison.
On the other hand, the Australian Dollar has been cascading down against the USD, breaking through all major daily Simple Moving Averages (SMA). SMA is a widely used technical indicator, and a breach below these averages suggests a bearish sentiment and a potential continuation of the downtrend.
The latest Core PCE data shows that prices gained 0.2% on a month-on-month (MoM) basis, which aligns with market expectations. This indicates a stable inflation rate in the US and suggests that the Federal Reserve’s efforts to control inflation may be yielding some results.
However, on a year-on-year (YoY) basis, Core PCE increased by 4.1%, which is slightly lower than the market’s expectations of 4.2% and a decrease from the previous month’s 4.6%. While the YoY figure is still elevated, the moderation in the rate of price increases might be perceived positively by the markets as it could alleviate some concerns about runaway inflation.
Given these inflation figures, it’s essential to consider the implications for monetary policy. The Federal Reserve closely monitors inflation data to determine its policy decisions. With Core PCE showing a relatively stable MoM increase and a slightly lower YoY figure, the Federal Reserve may adopt a more cautious approach to raising interest rates, which could lead to a stabilization of the US Dollar.
On the long-term chart, a crucial resistance level is identified at 0.7158, which corresponds to the high recorded in February. If the AUD/USD exchange rate manages to surpass this key hurdle, it could signal a shift in the outlook from sideways to a more bullish trend in the longer term. Traders and investors would closely monitor the price action around this level, as a decisive break above it may lead to a potential uptrend in the future.
On the other hand, the 0.6458 level, established in June, acts as a significant support level for bears (sellers). If the AUD/USD exchange rate breaches this level decisively, it may indicate a more bearish sentiment from a longer-term perspective. In such a scenario, traders and investors might anticipate a potential downtrend or further weakening of the Australian Dollar against the US Dollar.
AUD/USD daily analysis chart
- Check out our free forex signals
- Follow the top economic events on FX Leaders economic calendar
- Trade better, discover more Forex Trading Strategies
- Open a FREE Trading Account
- Read our latest reviews on: Avatrade, Exness, HFM and XM
Related Articles


Sidebar rates
Related Posts
