GBP/USD Strives to Surpass the 1.2779/93 Resistance Barrier to suppress downside bias

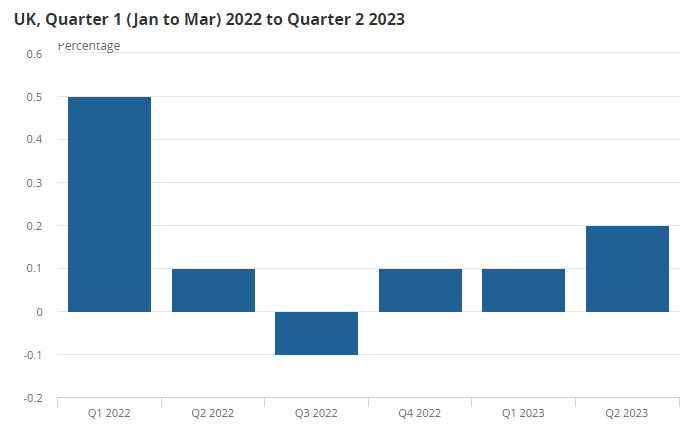
In the second quarter, the UK economy surpassed expectations with a growth of 0.2%, outperforming forecasts of no growth. Notably, June exhibited even stronger growth at 0.5%, surpassing the projected 0.2%. Darren Morgan, the director of economic statistics at the Office for National Statistics (ONS), highlighted the robust performance of various sectors, including publishing, car sales, and legal services within the services industry. However, the positive momentum was tempered by declines in the health sector, which faced setbacks due to strike action.
The year-on-year GDP estimate surged significantly to 0.9%, surpassing the projected 0.5% and marking a substantial improvement from the previous -0.4%.
Furthermore, both manufacturing and industrial production exceeded expectations. Notably, the volatile construction orders reading witnessed a substantial leap, soaring from -14.3% in the previous month to 2.6%.
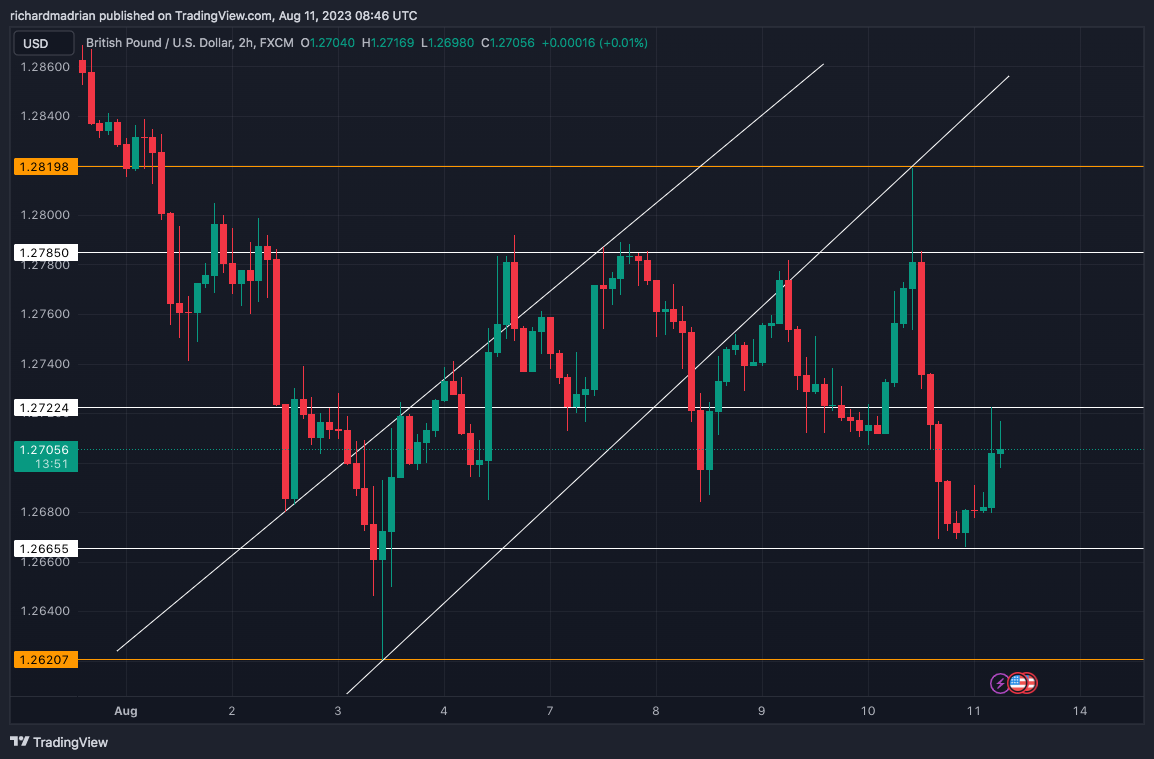
GBP/USD daily technical analysis
Despite the encouraging data, the British Pound remains relatively stable in early trading. Against the US dollar, it stands at 1.2715, representing a modest increase of about 0.3%, and it also demonstrates a slight improvement of around 0.15% against the Euro at 0.640.
The Bank of England will likely welcome the current developments, potentially influencing their considerations leading up to the upcoming monetary policy meeting. However, suppose the forthcoming Consumer Price Index (CPI) figures, scheduled for release next week, reveal a significant deceleration in UK inflation. In that case, the Monetary Policy Committee (MPC) might opt to maintain the existing interest rates at the upcoming session.
While the positive economic impetus could provide support for the British Pound, the lack of rate adjustments remains a crucial factor that hinges on incoming data. Consequently, the British Pound might encounter challenges in climbing higher over the forthcoming weeks.
Moving Averages and Indicators
The GBP/USD technical analysis reveals a nuanced picture based on key indicators. Currently, 11 indicators stand neutral, while 9 indicators suggest a sell signal and 5 indicators indicate a buy signal. The current price is at 1.27018, slightly below the 50-DAY SMA at 1.27624. Oscillators show 3 indicators in a neutral position, 8 indicating a sell, and none suggesting a buy signal.
Examining moving averages, we observe 8 indicators in a neutral stance, 1 indicating a sell, and 5 signalling a buy. To shift the immediate downside bias, a close above resistance from the 13-day exponential average and the recent reaction high at 1.2779/93 is necessary. However, for a stronger affirmation of the broader uptrend, a breakthrough above the recent ‘outside day’ high at 1.2997 is required. Such a move could pave the way for a resurgence of strength towards the 1.3143 high and eventually target the level of 1.3400/14.
The RSI stands at 42.3, indicating a neutral sentiment, while the MACD is at a negative -0.02, signifying a sell signal. This comprehensive analysis suggests that while the GBP/USD pair faces some immediate challenges, a decisive breakthrough of key levels could potentially reignite its broader upward trajectory.
- Check out our free forex signals
- Follow the top economic events on FX Leaders economic calendar
- Trade better, discover more Forex Trading Strategies
- Open a FREE Trading Account
- Read our latest reviews on: Avatrade, Exness, HFM and XM
Related Articles


Sidebar rates
Related Posts
