Gold Market Outlook: Precious Metal Holds Steady Amid Mixed Signals
The gold market commences the week on a subdued note in the early Asian trading hours on Monday.
The GOLD market commences the week on a subdued note in the early Asian trading hours on Monday.
Despite minimal day-on-day change, gold’s recent uptick finds support from the softer US Producer Price Index (PPI) figures and escalating geopolitical tensions in the Middle East. Currently, gold is priced at $2,045, reflecting a marginal 0.01% drop for the day.
The US PPI data for December reported a year-on-year increase of 1.0%, a downturn from November’s revised 0.8% rise and falling short of the anticipated 1.3%. The annual core PPI, stripping out the volatile food and energy sectors, ascended by 1.8% in December, a deceleration from 2.0% previously, also undershooting the forecasted 1.9%.
Notably, the monthly core PPI held steady, marking the third month without change.The PPI data indicates emerging deflationary pressures, bolstering the market’s belief in the Federal Reserve’s potential interest rate cut in March.
Market odds favoring a rate reduction have climbed to 74.2%, a lift from 70% the previous week, as per the CME FedWatch Tool. This sentiment weakens the US dollar and conversely strengthens gold prices.
Additionally, as a result of rising geopolitical unrest, demand for safe-haven assets has contributed to gold’s gains. Notable military actions by the United States and the United Kingdom against Houthi targets in Yemen signify a robust stance against threats to commercial maritime routes.
With the US observing Martin Luther King Jr. Day, resulting in a pause of major economic releases, risk sentiment is anticipated to steer gold price movements. Key US economic indicators are scheduled later in the week, including the NY Empire State Manufacturing Index on Tuesday, Retail Sales data on Wednesday, and the Michigan Consumer Sentiment Index on Friday.
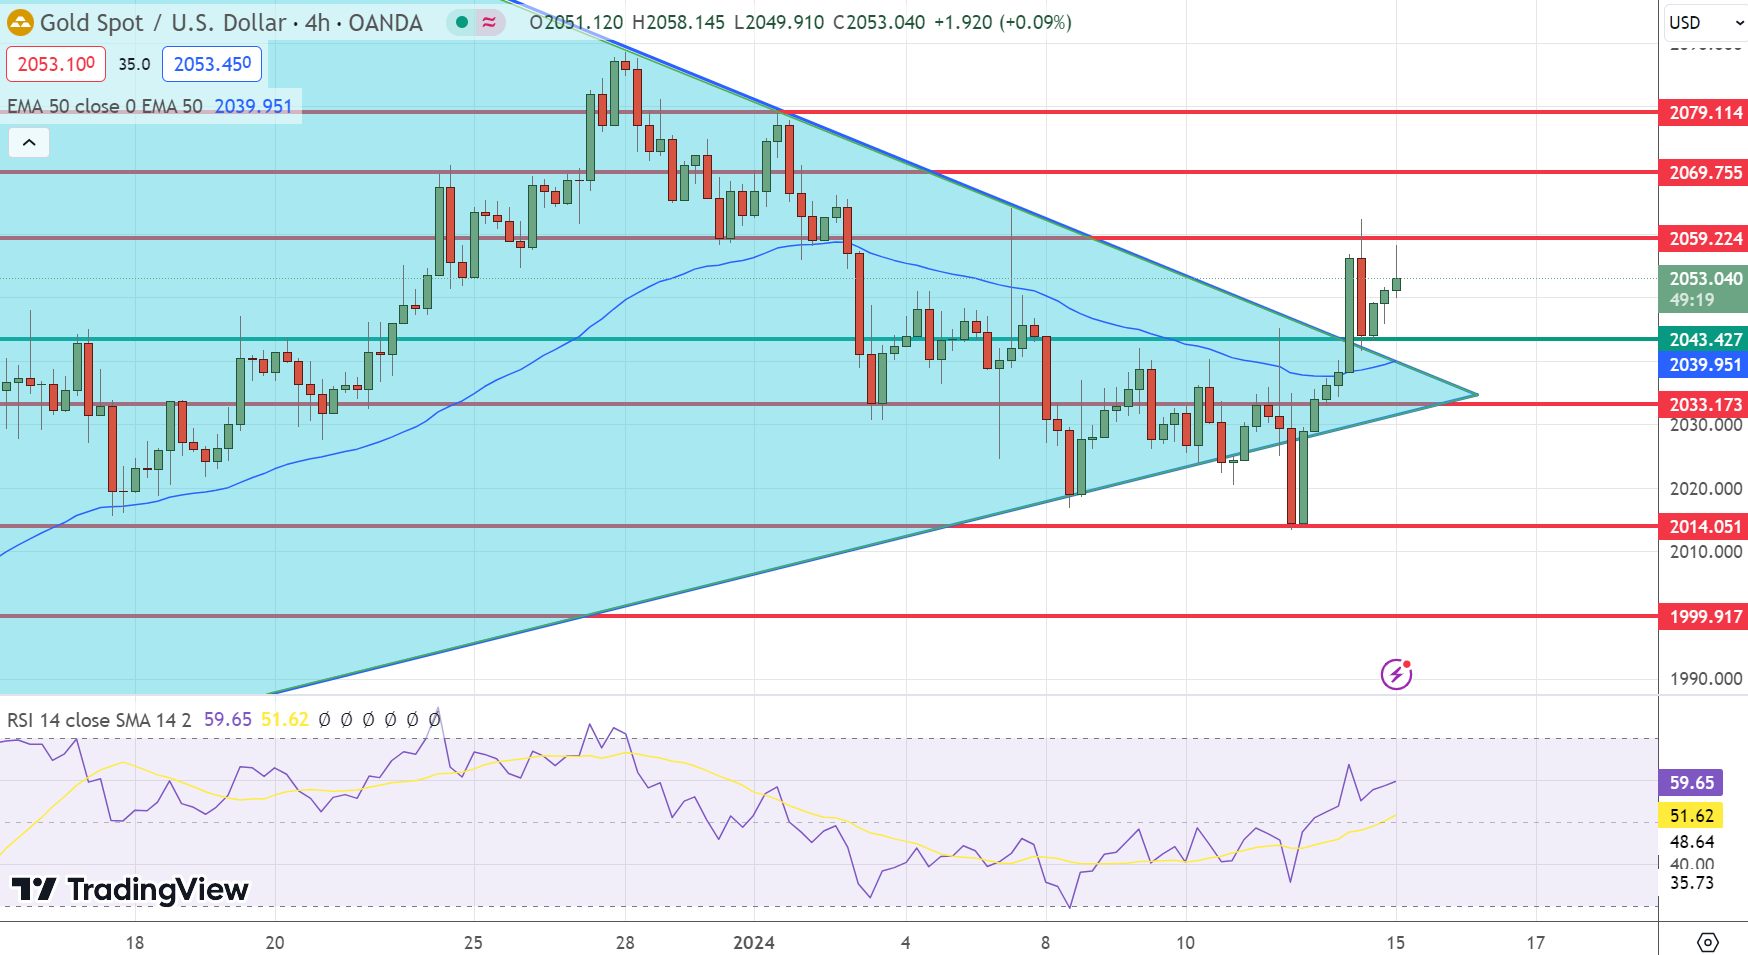
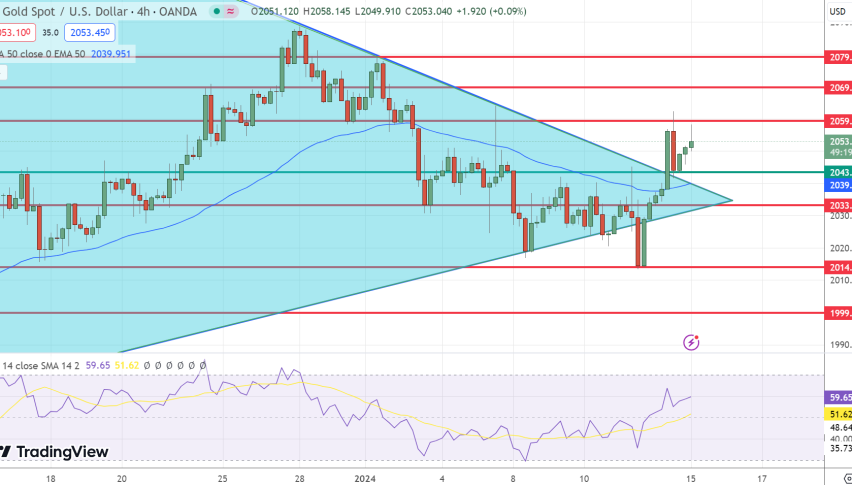
Gold Technical Analysis
The GOLD price is presently at a crossroads near the $2065.70 mark, with mixed technical indicators at play. The stochastic oscillator suggests potential downward momentum, while the EMA50 provides bullish underpinning, potentially aiding intraday advances, particularly after overcoming the minor bearish channel resistance depicted on the chart.
In light of these conflicting signals, a cautious approach is warranted until a more decisive market trend emerges. A dip below the $2037.50 support level may trigger a continuation of the corrective bearish trend, with initial targets at $2016.90 and potential further decline to $1977.46 if that level is breached.
Conversely, a push above the $2065.70 resistance could signal a resurgence of the principal bullish trend, with immediate targets at the $2100.00 threshold and possibly extending to $2144.60 in the short term.
Today’s projected trading range lies between the $2035.00 support and the $2075.00 resistance level, with the day’s trend expected to remain neutral.
Gold XAU Live Chart
- Check out our free forex signals
- Follow the top economic events on FX Leaders economic calendar
- Trade better, discover more Forex Trading Strategies
- Open a FREE Trading Account
- Read our latest reviews on: Avatrade, Exness, HFM and XM
Related Articles


Sidebar rates
Related Posts
Ava

