Gold Edges Past $2,024 Amid Bearish Sentiment and Pending ECB Decision
In the Asian trading session on Wednesday, Gold's spot price has declined slightly to $2,024. After last week's 2% fall, the current..
In the Asian trading session on Wednesday, gold‘s spot price has declined slightly to $2,024. After last week’s 2% fall, the current sentiment leans neutral-to-bearish, with a glimmer of bullish possibility as short-term indicators hint at a potential shift in momentum.
Economic Data and Fed Stance Rein in Gold’s Upside
Robust U.S. economic figures alongside a hawkish Federal Reserve posture are pressuring metal markets, with rising yields curtailing the allure of non-yielding assets like GOLD .
This comes as expectations for a Fed rate cut shift to May, given the positive economic indicators.
Geopolitical Tensions Offer Limited Support for Gold
Despite downward pressures, escalating Middle East tensions offer some support for Gold’s safe-haven status. Concurrently, a weaker U.S. Dollar, recently hitting a weekly low, provides some stability for Gold prices.
Anticipation Builds for Key Economic Announcements
Investors remain cautious, awaiting global PMIs, U.S. Q4 GDP, and Core PCE Price Index data due this week. These, alongside the ECB’s policy decision, are poised to stir market volatility and potentially influence Gold’s price direction.
Regional Conflicts and Policy Expectations Shape Market Outlook
Middle East conflicts and China’s economic challenges underpin Gold’s value, while market sentiment on Fed policy easing adjusts to recent economic resilience. U.S. bond yields and the ECB’s upcoming meeting are now key focal points for traders.
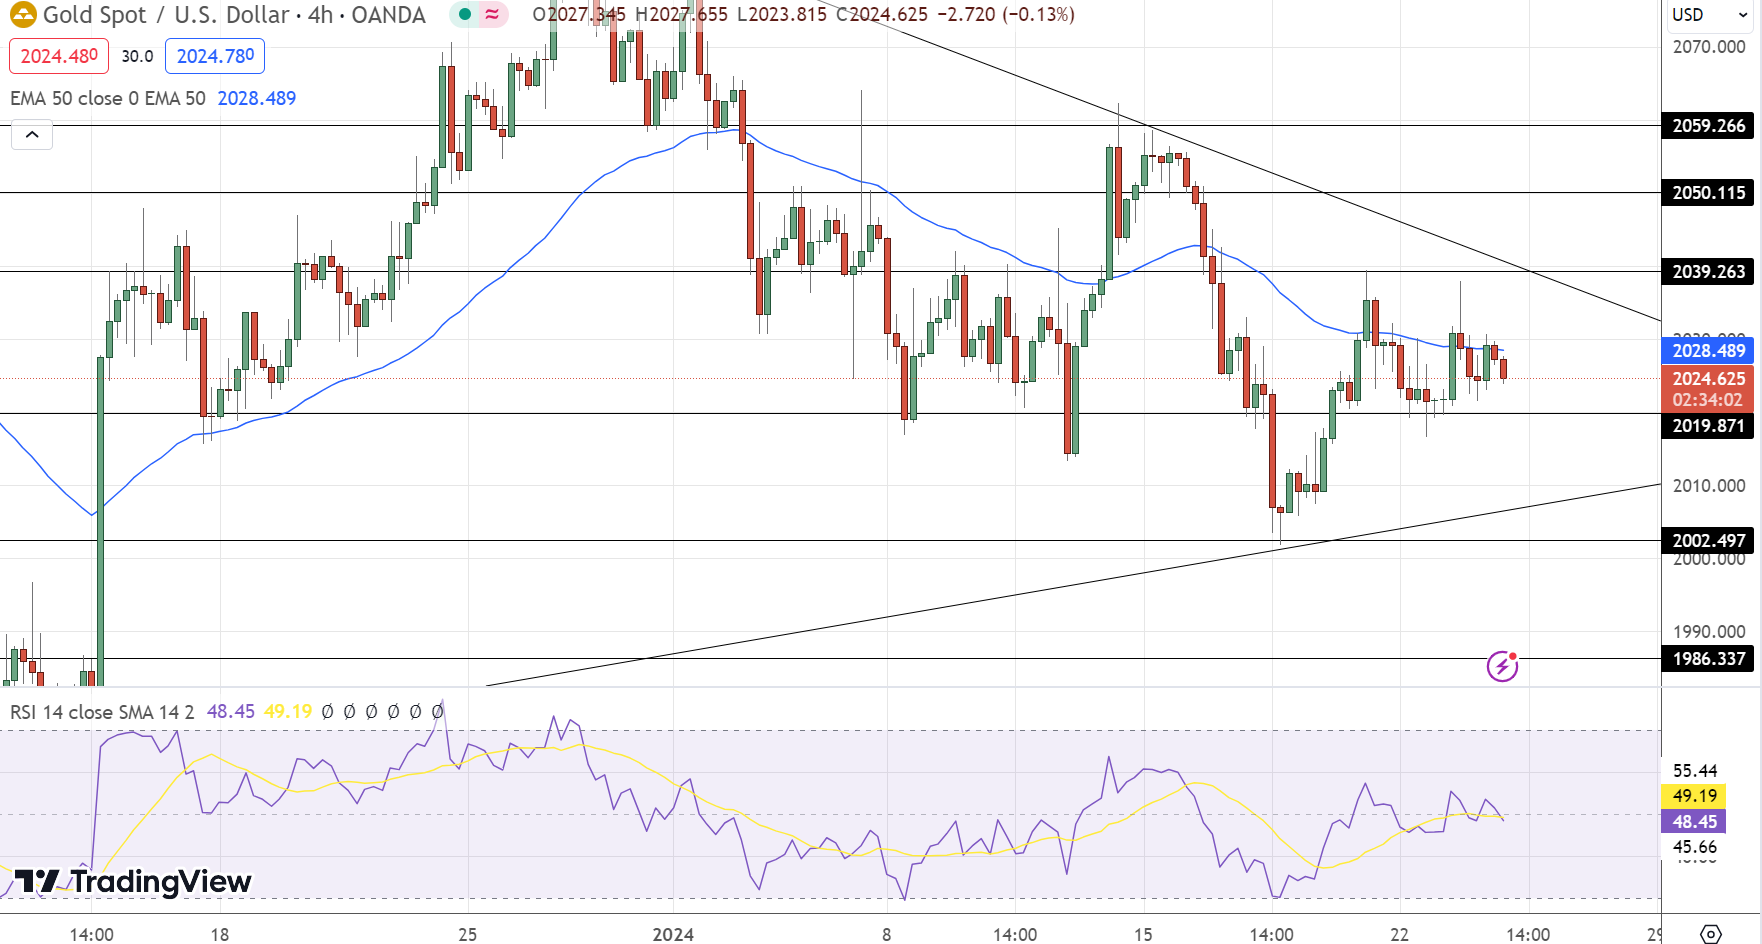
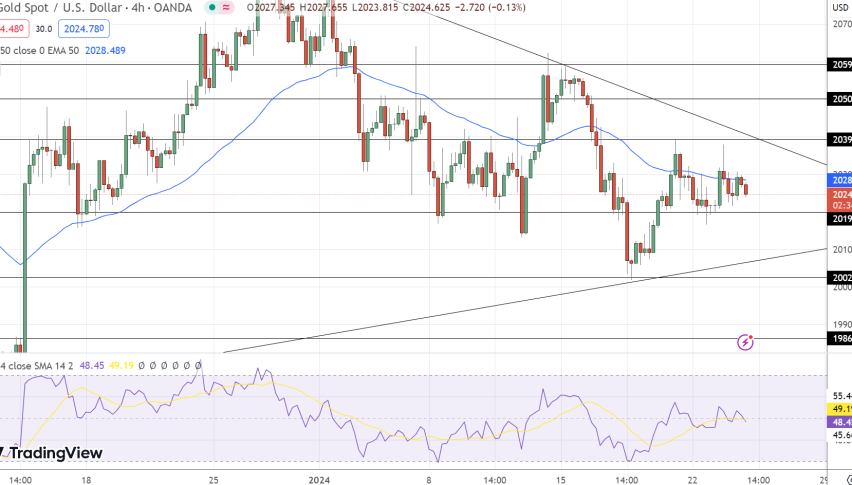
Gold Technical Outlook
On January 24, gold’s market stance reflects a pattern of cautious trading, with its current price maintaining a narrow range between $2,040 and $2,020. The pivotal point for the commodity stands at $2,031.76, surrounded by multiple resistance levels – the immediate one at $2,040.02, followed by $2,050.91 and $2,065.54.
Support levels are similarly staggered, with the closest at $2,016.49, and subsequent levels at $2,002.00 and $1,986.55.A key observation lies in the alignment of the 50-Day Exponential Moving Average (EMA) and the 200-Day EMA, both hovering around $2,028, suggesting a potential for market stability or indecision.
The current trading pattern of gold is characterized by sideways movement, indicating a market in equilibrium, with neither buyers nor sellers gaining definitive control. This consolidation phase suggests that a breakout in either direction could set the tone for future trends.
The overall trend for GOLD appears bullish above the $2,020 mark, suggesting that maintaining above this threshold could lead to further uptrends.
Conversely, slipping below this level might shift the sentiment to bearish. In the short term, market watchers should anticipate gold testing these resistance and support levels, with a breakout potentially offering clearer insights into its future trajectory.
Gold XAU Live Chart
- Check out our free forex signals
- Follow the top economic events on FX Leaders economic calendar
- Trade better, discover more Forex Trading Strategies
- Open a FREE Trading Account


