S&P 500 Stalls at $4890 Amid Intel-Led Tech Slump and Slowing Inflation Data
S&P 500 displayed minimal movement, hovering around the $4890 mark, as market participants digested a mix of technology sector struggles...
On January 26th, the S&P 500 displayed minimal movement, hovering around the $4890 mark, as market participants digested a mix of technology sector struggles, led by Intel, and the latest indicators of diminishing inflation rates.
As of 15:00 ET (20:00 GMT), while the Dow Jones Industrial Average saw a modest rise of 70 points, or 0.2%, the S&P 500 remained relatively unchanged, and the Nasdaq Composite experienced a slight dip of 0.3%.
Tech stocks felt the brunt of a downturn following Intel (NASDAQ:INTC)’s underwhelming forecast for the first quarter, causing the company’s shares to plummet by 12%. However, Deutsche Bank conveyed a measure of positivity, noting the downturn did not affect Intel’s primary PC and datacenter operations, and projected a rebound in revenue and EPS growth through 2024.
Additionally, the tech sector took another hit with a more than 3% decline in Western Digital Corporation (NASDAQ:WDC), despite its earnings and guidance surpassing expectations.
US Core Personal Consumption Slows Down; SPX Bearish
On the inflation front, the Federal Reserve’s favored measure, the “core” personal consumption expenditures price index, showed a slowdown to 2.9% in December, a drop from the previous month’s 3.2%, and below anticipated figures of 3%. This easing of inflation is likely a positive sign for the Fed as they approach their policy meeting on January 30-31.
Consumer spending also presented a positive surprise, rising by 0.7%, significantly higher than the predicted 0.4% increase. This uplift suggests that the Fed’s inflation-reducing measures might not trigger a harsh recession.
In earnings news, T-Mobile US (NASDAQ:TMUS) slightly declined after missing its fourth-quarter profit targets, despite forecasting strong subscriber growth. Conversely, American Express (NYSE:AXP) saw its shares increase by 7% after exceeding full-year profit forecasts. Visa (NYSE:V), however, faced a setback, its shares falling 1.4% amid cautious second-quarter sales projections and an expected slowdown in net revenue growth compared to the previous year.
S&P 500 Price Forecast
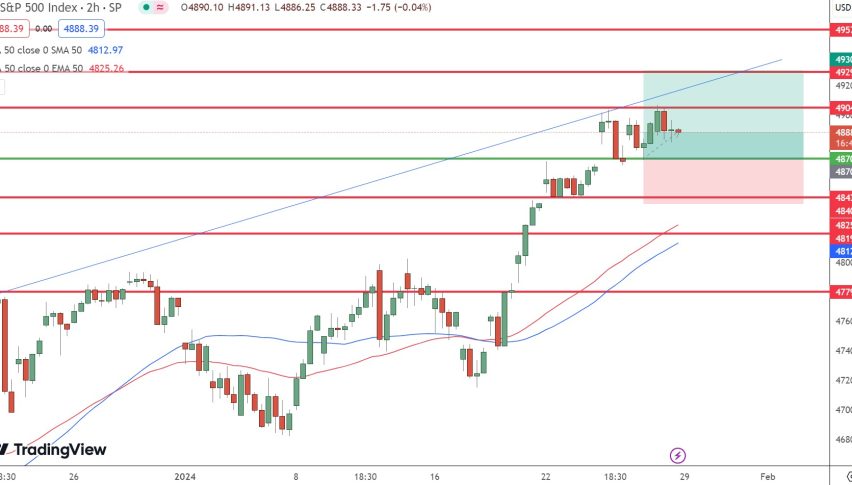
In our daily technical outlook for the S&P 500 (SPX) on January 26th, the index presents a notable performance, climbing to 4894.17, an uptick of 0.53%. The current market landscape is defined by key price levels and technical indicators, offering a deeper insight into the SPX’s short-term trajectory.
Analyzing the pivotal price points, the SPX’s pivot stands at $4,902.08. The immediate resistance level is observed at $4,921.52, followed by successive resistances at $4,947.45 and $4,974.55. In terms of support, the SPX finds immediate backing at $4,859.07, with further cushions at $4,830.79 and $4,808.40.
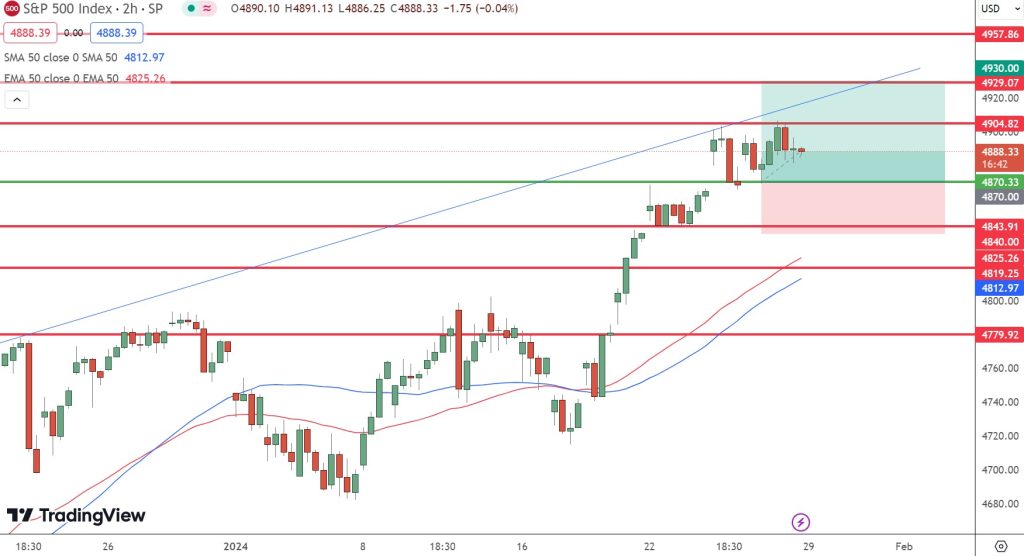
The technical indicators reveal an intriguing narrative. The 50-day Exponential Moving Average (EMA) hovers at $4,765.27, while the 200-day EMA is positioned at a lower level of $4,567.38. These EMAs are key to understanding the market’s sentiment; their current values hint at a buying trend within the market.
A closer look at the SPX’s chart patterns suggests a lateral movement. The index is navigating within a narrow band, oscillating between $4900 and $4870. The significance of this range cannot be overstated, as a breakout in either direction could signal a potential bearish or bullish trend. This observation, coupled with the supportive trend indicated by the 50 and 200-day EMAs, provides a nuanced perspective on the market dynamics.
In conclusion, the overall trend for SPX appears bullish above $4870.33, though this sentiment could swiftly reverse if the index falls below this threshold. In the short term, the expectation is that the SPX will test its resistance levels, particularly eyeing the $4,921.52 mark in the coming days. This forecast hinges on the current market conditions and the index’s ability to maintain its momentum within the specified range.
- Check out our free forex signals
- Follow the top economic events on FX Leaders economic calendar
- Trade better, discover more Forex Trading Strategies
- Open a FREE Trading Account


