WTI Hits $74.20: Fed Rate Hints & OPEC Cuts Shape Market Outlook
Western Texas Intermediate (WTI), currently positioned at approximately $74.20, interrupts its downward trajectory, buoyed by anticipations

Western Texas Intermediate (WTI), currently positioned at approximately $74.20, interrupts its downward trajectory, buoyed by anticipations of the Federal Reserve’s interest rate adjustments. The slight uplift in WTI follows Jerome Powell’s hints at a nearing conclusion to aggressive rate hikes, which generally fosters economic expansion and, by extension, elevates oil demand.
China’s Economic Interventions and OPEC’s Production Strategy
China is working to improve its real estate sector and has provided a boost to the market, which has made investors optimistic. This is important for the oil market, as China is a major player.
OPEC is considering extending its current production curtailments to the next quarter to keep oil prices stable, which involves a significant reduction of 2.2 million barrels per day.
Key Economic Indicators Ahead: US Nonfarm Payrolls
The upcoming release of the US Nonfarm Payrolls and other significant economic indicators, such as the Unemployment Rate, Average Hourly Earnings, Factory Orders, and Michigan Consumer Sentiment, have the potential to directly impact the valuation of WTI.
Traders are closely monitoring these figures as they can affect the USD and thus, WTI prices. This presents an opportunity for strategic positioning in the oil market.
WTI Crude Oil Price Forecast; Technical Outlook
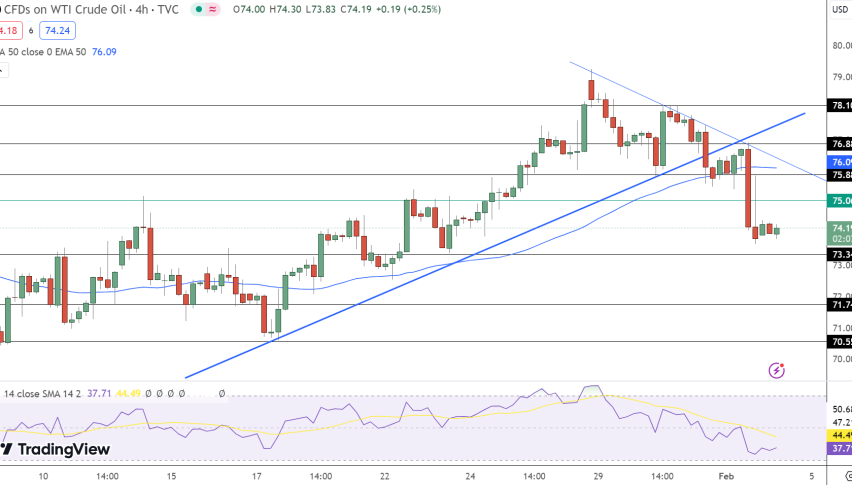
Crude Oil has experienced a modest rise in today’s trading session, marking a 0.44% increase to $74.15. In the 4-hour chart, the commodity is below its pivot point of $75.06, suggesting bearish momentum.
Immediate resistance is found at $75.88, with further resistance levels at $76.88 and $78.10. On the downside, support levels are established at $73.34, $71.74, and $70.55, indicating potential floors for price corrections.
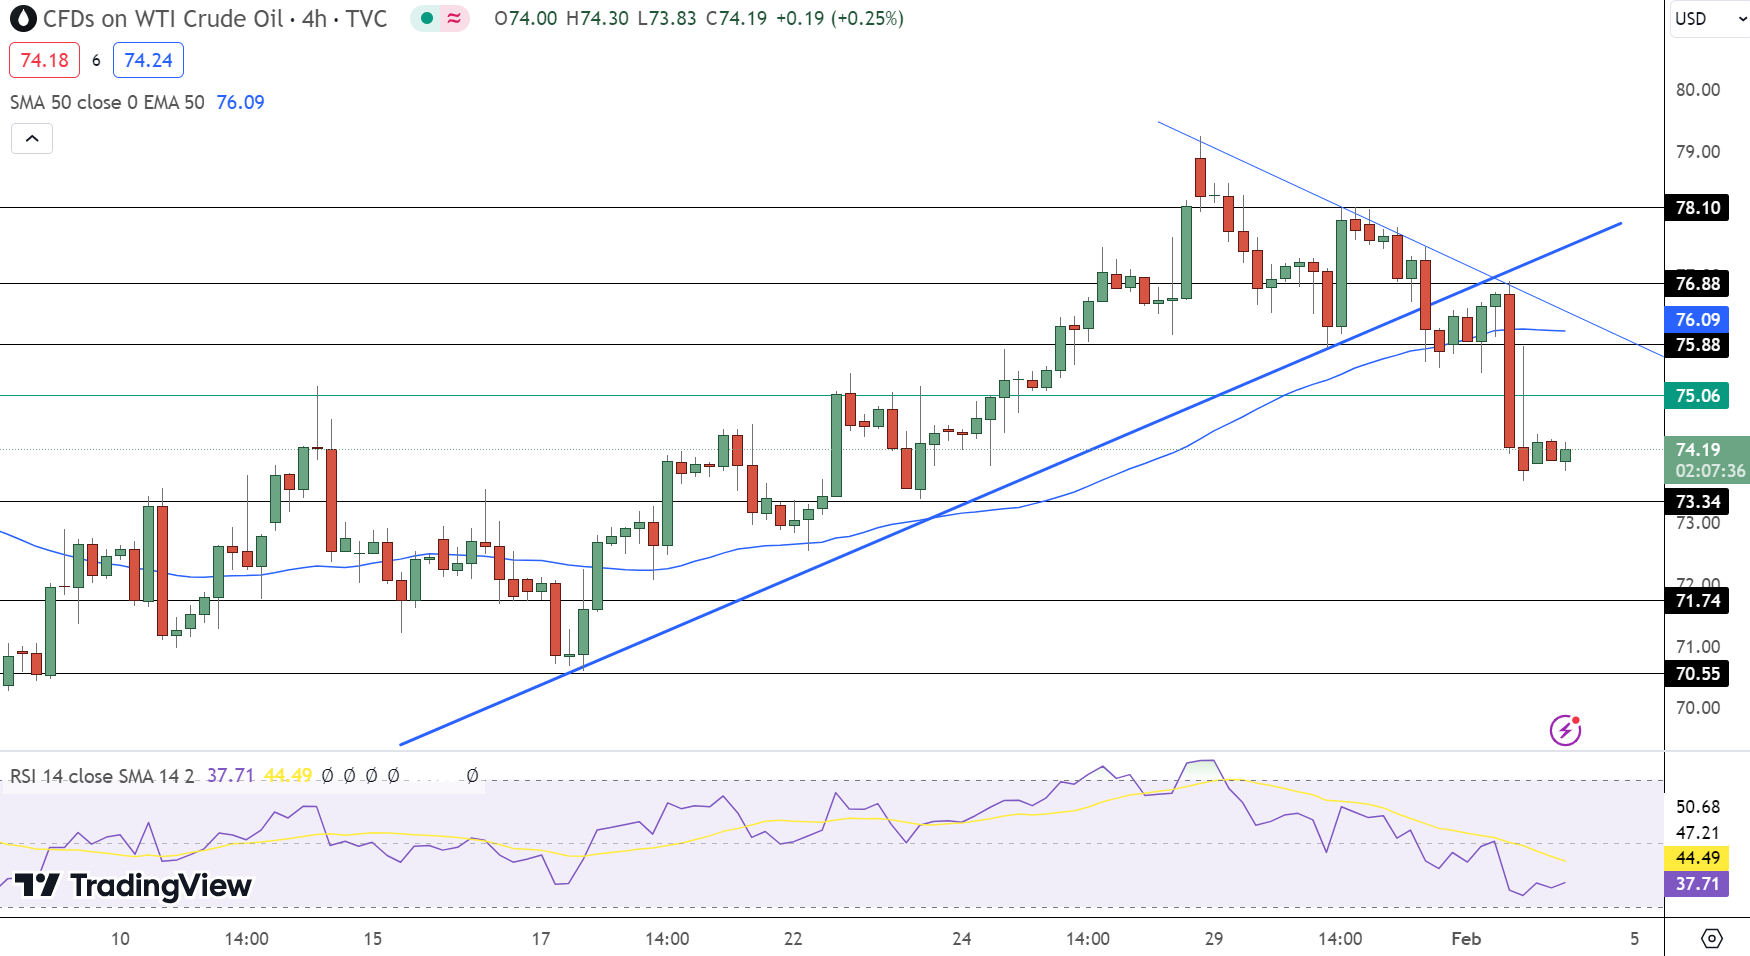
The Relative Strength Index (RSI) stands at 37, highlighting a bearish sentiment among traders. The 50-day Exponential Moving Average (EMA) at $76.09 reinforces the downward trend, further confirmed by a bearish engulfing pattern below the $76 level. This pattern, along with a violated ascending triangle and a prevailing downward trendline, suggests a continuation of the bearish trend.
- Check out our free forex signals
- Follow the top economic events on FX Leaders economic calendar
- Trade better, discover more Forex Trading Strategies
- Open a FREE Trading Account
- Read our latest reviews on: Avatrade, Exness, HFM and XM
Related Articles


Sidebar rates
Related Posts
