Gold Price Forecast: Nears $2,045 Amid US PCE Index Release; Next Target $2,065?
During the Asian session on Friday, the gold price (XAU/USD) remained stable, trading around the $2,045 mark, closely approaching its highest level in nearly a month.
•
Last updated: Friday, March 1, 2024
During the Asian session on Friday, the gold price (XAU/USD) remained stable, trading around the $2,045 mark, closely approaching its highest level in nearly a month.
The possibility of a future Federal Reserve (Fed) rate cut has increased with the release of the US Personal Consumption Expenditures (PCE) Price Index for January, which shows the lowest annual inflation rate in three years.
Despite this, the 200-day SMA’s influence on the US dollar made it difficult for it to benefit from its recovery, which ultimately helped the precious metal.
Inflation Data and Federal Reserve Stance
While the US inflation figures aligned with expectations, hinting at a potential rate cut by the Fed later in the year, comments from various FOMC members suggested a more cautious approach to interest rate adjustments.
Investors now anticipate that the Fed may delay any rate cuts until the June policy meeting, supporting higher US Treasury bond yields and limiting the upside for gold, a non-yielding asset.
Market Sentiment and Gold Price Dynamics
The prevailing positive sentiment in global equity markets also plays a crucial role in tempering bullish bets on the traditionally safe-haven XAU/USD.
Despite supportive factors such as the anticipated Fed rate cut, elevated Treasury yields and a buoyant risk-on environment pose challenges for Gold’s upward trajectory.
Central Bank Officials’ Outlook
Fed officials, including Atlanta’s Raphael Bostic and San Francisco’s Mary Daly, have voiced their positions on the timing and necessity of interest rate adjustments, reflecting a balanced view towards managing inflation while considering economic strength.
The bond market’s expectations, influenced by these comments, coupled with sustained risk appetite in equity markets, suggest a cautious approach for investors aiming for further gains in gold prices.
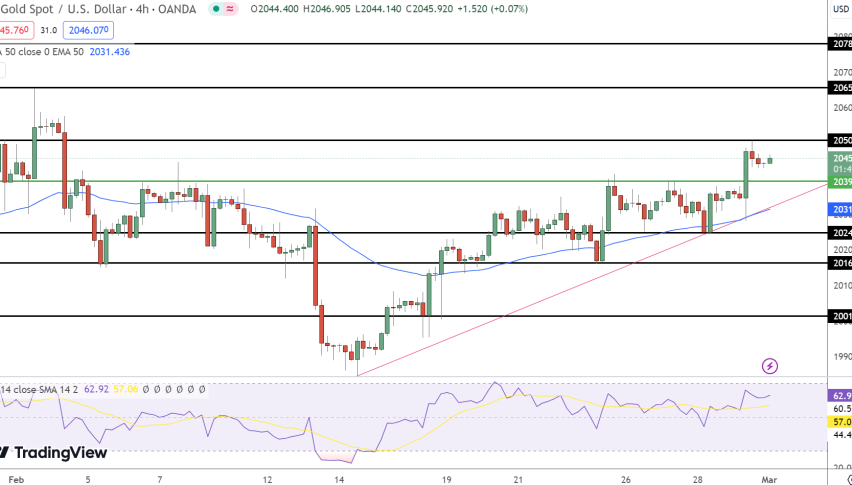
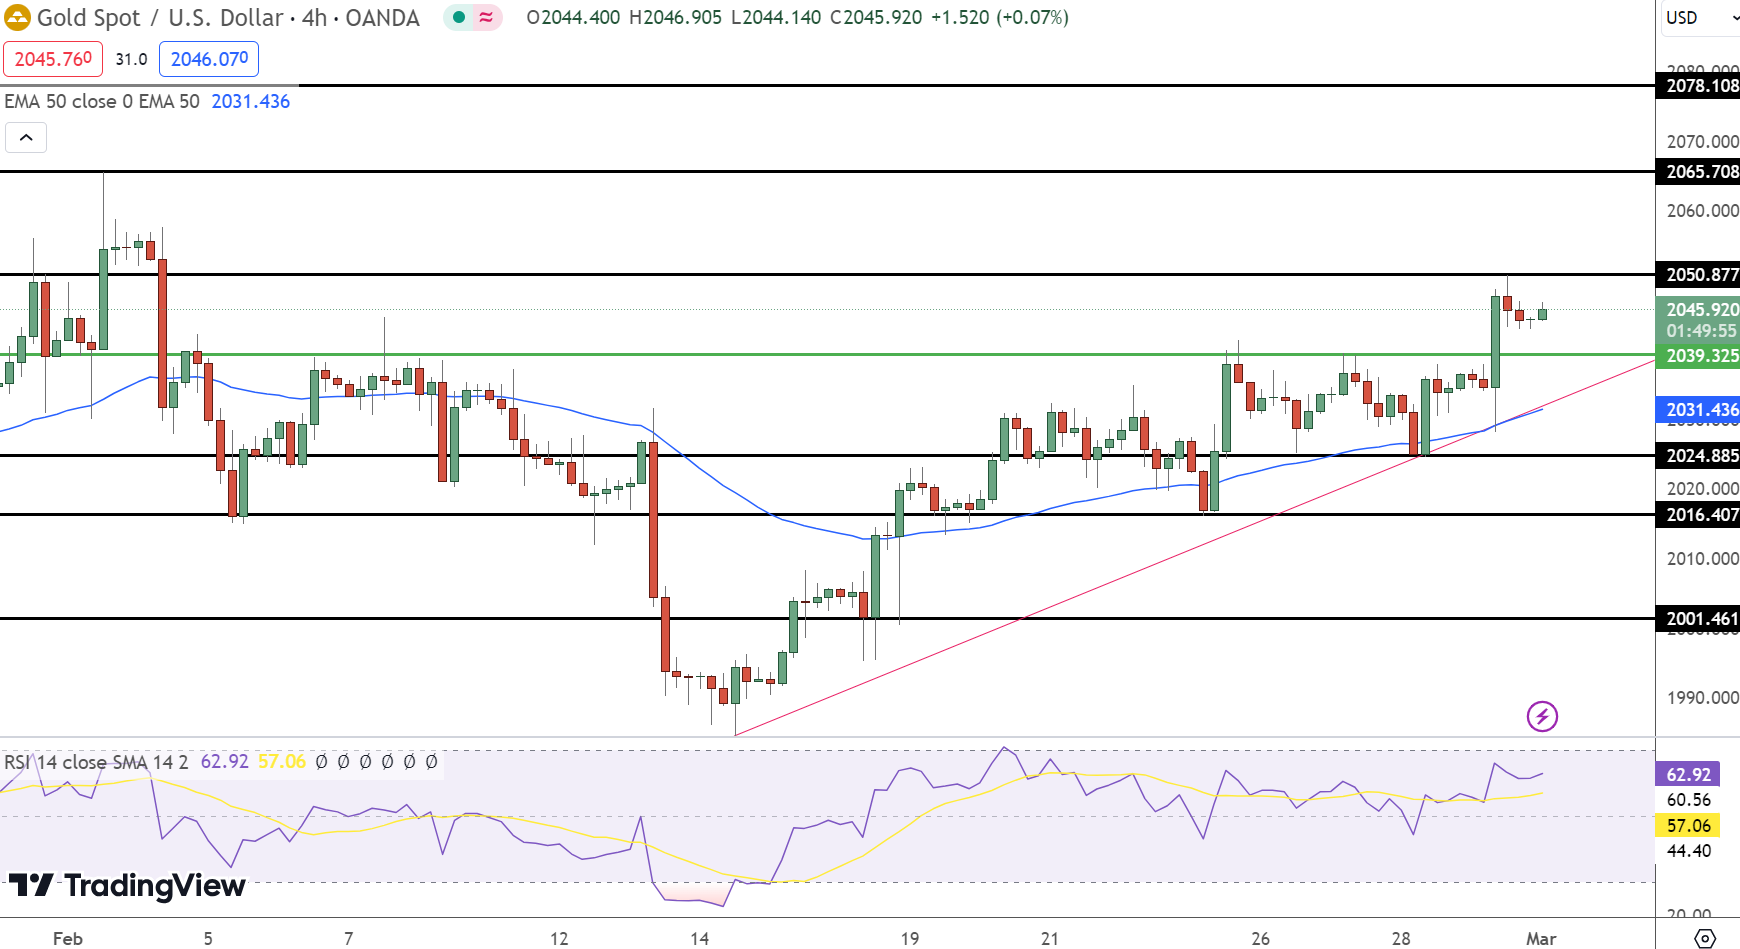
Gold (XAU/USD) Price Forecast: Technical Outlook
On March 1, GOLD (XAU/USD) observed a slight uptick in its price, marking a 0.10% increase to settle at $2045.92. This movement aligns with a cautious but positive sentiment among traders as gold hovers near key technical thresholds.
The established pivot point at $2039.33 suggests foundational support, with immediate resistance seen at $2050.88.
- Overall Trend: Bullish, with a significant pivot at $2039 indicating potential for further gains.
- Key Indicators: RSI at 62 and a 50-day EMA of $2031.44 support the upward trajectory.
- Technical Patterns: Observations of a triple top and ascending triangle pattern breakout suggest a strong buy signal above the $2039 level.

Further resistance levels are mapped at $2065.71 and $2078.11, indicating potential ceilings in price movement. Conversely, support levels below the pivot are identified at $2024.89, $2016.41, and $2001.46, offering fallback positions.
- Check out our free forex signals
- Follow the top economic events on FX Leaders economic calendar
- Trade better, discover more Forex Trading Strategies
- Open a FREE Trading Account
- Read our latest reviews on: Avatrade, Exness, HFM and XM
ABOUT THE AUTHOR
See More
Arslan Ali Butt
Lead Markets Analyst – Multi-Asset (FX, Commodities, Crypto)
Arslan Ali Butt serves as the Lead Commodities and Indices Analyst, bringing a wealth of expertise to the field. With an MBA in Behavioral Finance and active progress towards a Ph.D., Arslan possesses a deep understanding of market dynamics.
His professional journey includes a significant role as a senior analyst at a leading brokerage firm, complementing his extensive experience as a market analyst and day trader. Adept in educating others, Arslan has a commendable track record as an instructor and public speaker.
His incisive analyses, particularly within the realms of cryptocurrency and forex markets, are showcased across esteemed financial publications such as ForexCrunch, InsideBitcoins, and EconomyWatch, solidifying his reputation in the financial community.
Related Articles


Sidebar rates
Related Posts
