S&P 500 Nears $5,100; Eyes on Fed’s Rate Cut Speculation; More Upside Ahead?
The global market sentiment has been gaining momentum, contributing to the bullish performance of the S&P 500, which has been hitting
The S&P 500 witnessed an uptick of 0.52% in the latest session, signaling a positive momentum among investors. This surge is largely driven by the strong performance of the technology sector, with tech stocks making up a significant portion of the index and outperforming other sectors. The Nasdaq has also reached record levels.
This positive trend comes as investors grow more confident in the prospect of eventual interest-rate cuts from the Federal Reserve.
However, geopolitical issues and external factors can still create volatility, so investors should remain vigilant and informed about developments that could affect the market.
Federal Reserve’s Interest Rate Cut Stance and US Economic Data
On the US front, Federal Reserve’s stance on interest rates has been closely watched by investors, as any changes in monetary policy can have a major impact on the stock market. Recently, there has been speculation that the Fed may cut rates later this year, which has helped boost investor confidence.
This speculation has been fueled by the release of US economic data, including the personal consumption expenditures price index, which came in line with expectations. The annual core inflation growth rate was the lowest in three years, but monthly figures were up by 0.4%, indicating some inflationary pressures.
Investors are hopeful that the expected decline in the United States core PCE Price Index data for January won’t push the Federal Reserve (Fed) to raise interest rates in the June policy meeting.
According to the CME FedWatch tool, there’s about a 52% chance of a 0.25% rate cut in June, which hasn’t changed much after the inflation data release. For the March and May meetings, investors expect interest rates to stay between 5.25% and 5.50%.
Therefore, the speculation of a potential rate cut by the Federal Reserve and the expectations regarding interest rates have had a positive impact on investor confidence, contributing to the recent record highs in the S&P 500.
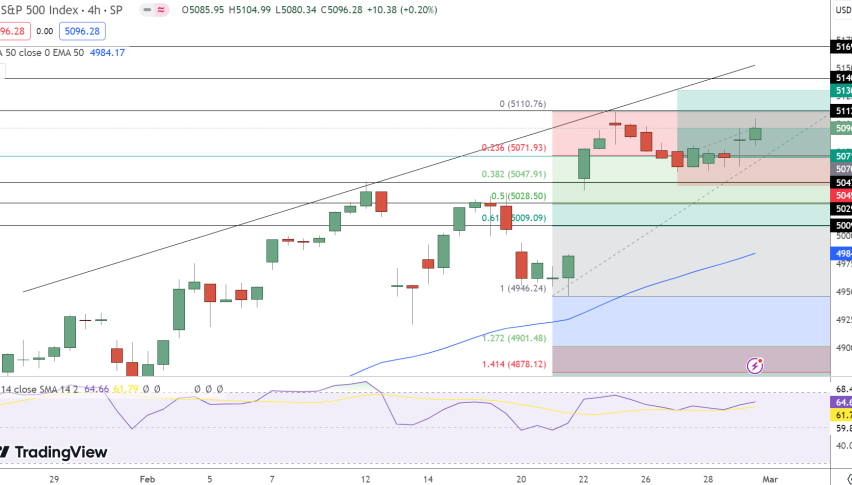
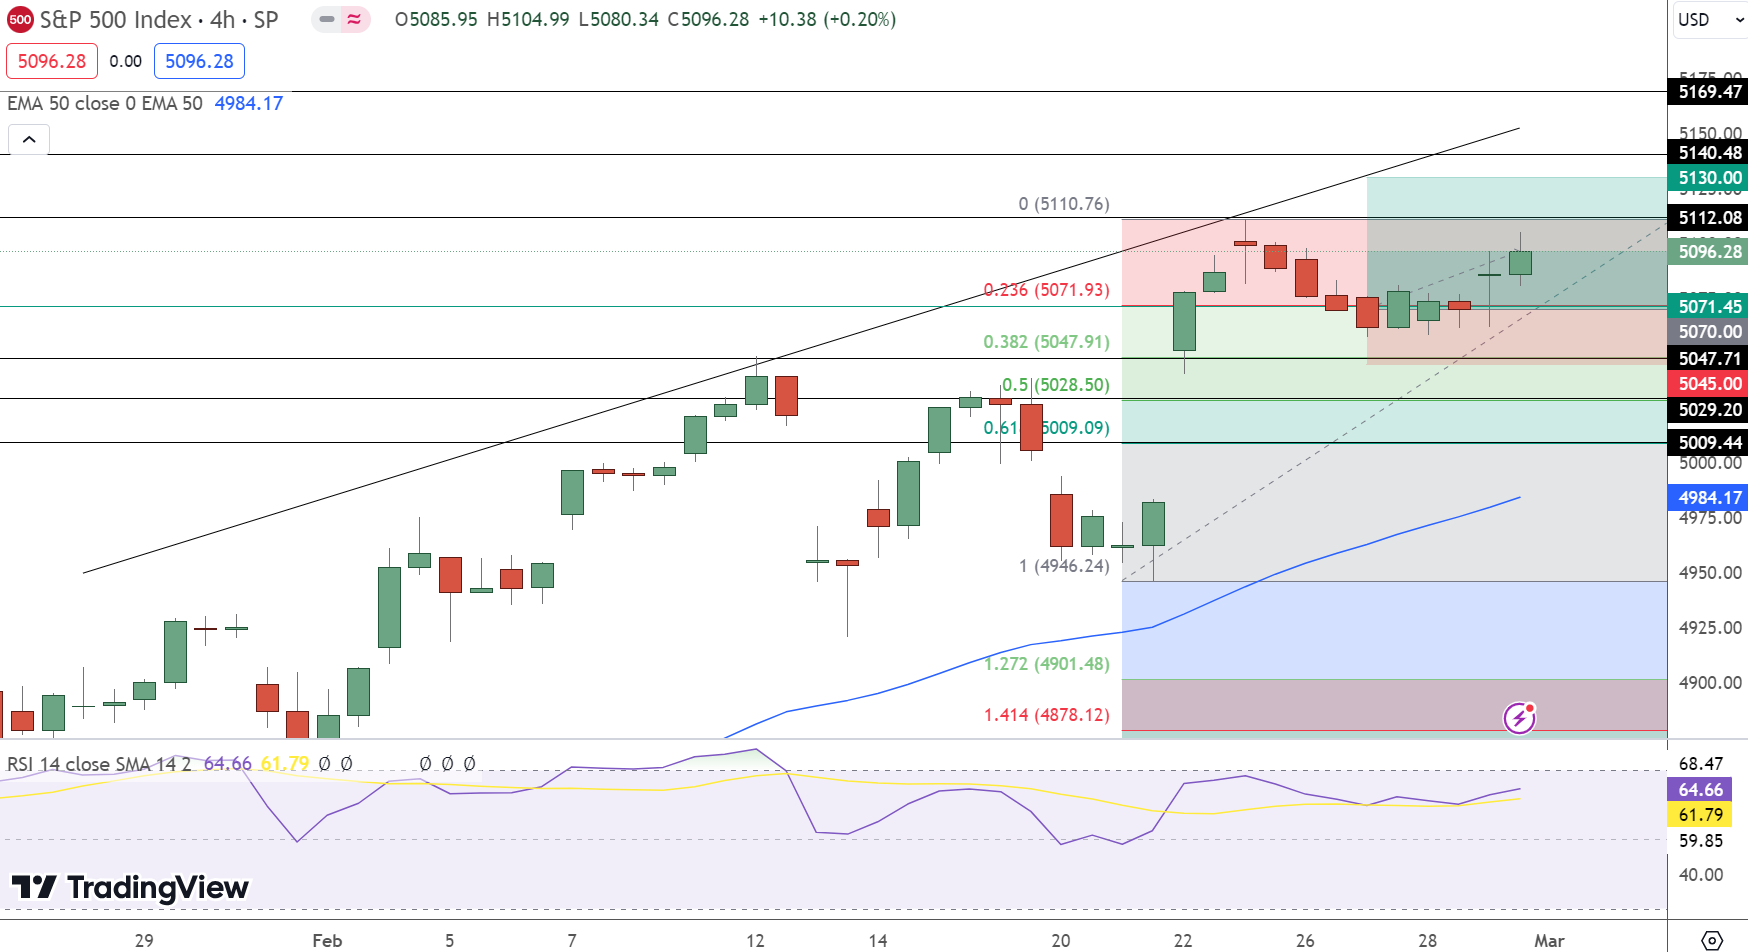
S&P 500 (SPX) Price Prediction: Technical Analysis
The index now navigates around pivotal price points, with a current pivot at $5,096. Despite this, the first immediate resistance is unusually marked below the pivot at $5,071, followed by higher resistances at $5,112 and $5,140, suggesting potential clerical errors in the provided data.
Support levels are established at $5,048, $5,029, and $5,009, providing a safety net against downward movements.
The RSI indicator at 64 points towards a growing bullish sentiment, indicating strong buying pressure. Furthermore, trading above the 50 EMA of $4,984 underscores the index’s robust upward trajectory.
- Check out our free forex signals
- Follow the top economic events on FX Leaders economic calendar
- Trade better, discover more Forex Trading Strategies
- Open a FREE Trading Account
- Read our latest reviews on: Avatrade, Exness, HFM and XM
Related Articles

Sidebar rates
Related Posts
