USD to CAD Rate Bounces Off Support After Soft Manufacturing Sales
The USD to CAD rate has been trading in a 100 pip range, but with a slight bullish bias as highs are getting higher. Today the CAD weakened.
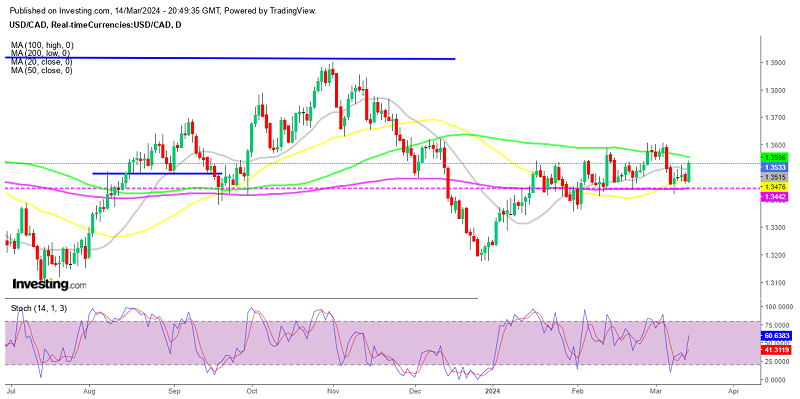
The USD to CAD rate has been trading in a 100 pip range, but with a slight bullish bias as highs are getting higher. Today the CAD turned softer after the manufacturing sales numbers from Canada, which sent USD/CAD around 70 pips higher, after the 200 SMA (purple) held as support on the H4 chart.
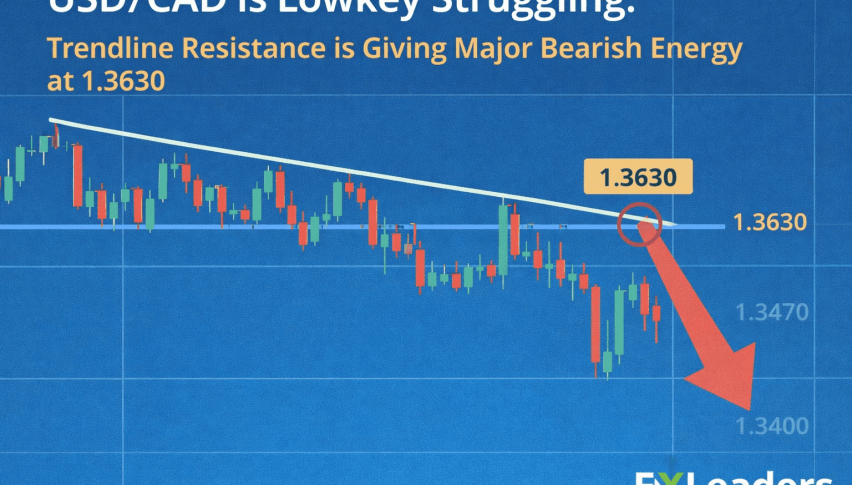
So, buyers in USD/CAD are regaining control, as the pair bounced off the 200-day moving average at 1.34o on the 4-hour chart. Earlier today, sellers were finding buying pressure against the 200-day moving average, but they have since given back. This upward movement in USD/CAD was supported by rising yields and increased dollar buying across various major currency pairs during the US session.
USD/CAD H4 Chart – Trading Between Moving Averages
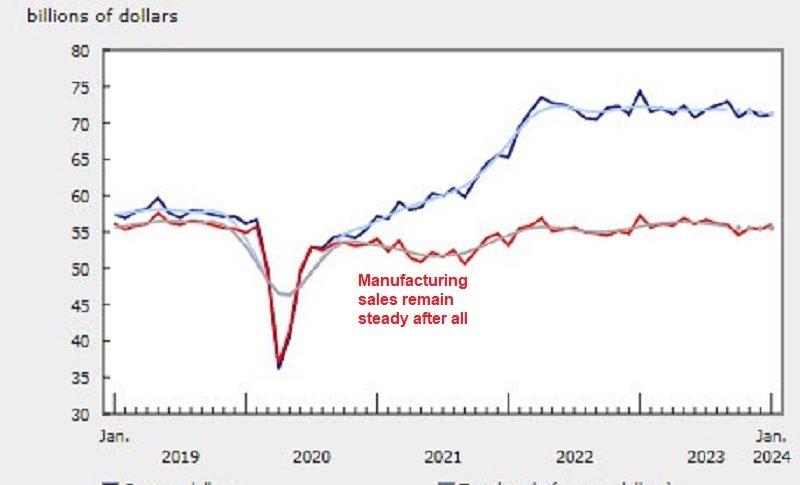
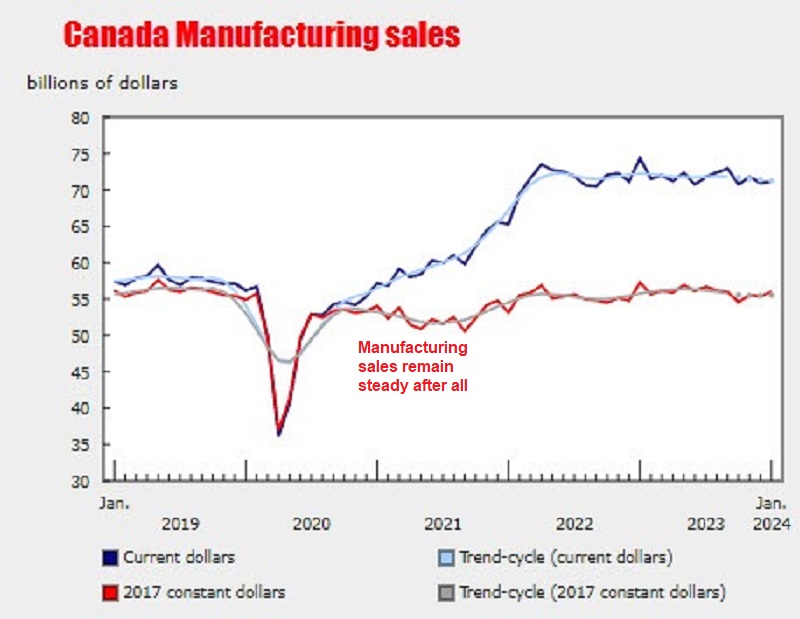
Canadian manufacturing sales for January 2024
- Canada manufacturing sales for January 0.2% versus 0.4% estimate
- Prior month -1.1% revised from -0.7% initially reported
- Manufacturing sales increased by 0.2% to $71.1 billion in January. The estimate was for a 0.4% gain
- Sales rose in 11 of the 21 subsectors, with transportation equipment (+4.3%) and chemicals (+3.5%) leading the gains.
- The aerospace product and parts industry group saw the largest decline at -16.7%.
- Sales in constant dollars rose by 1.1% in January.
- The Industrial Product Price Index decreased slightly by 0.1%.
Inventories decreased by 0.2%:
- Total inventories decreased by 0.2% to $122.1 billion in January, following a 1.4% drop in December.
- The decrease was primarily due to lower raw material inventories, which fell by 1.2%.
- Significant declines in inventories were seen in primary metals (-4.2%) and petroleum and coal (-4.5%).
- The inventory-to-sales ratio remained unchanged at 1.72 in January, indicating the time required to exhaust inventories if sales continued at the current level.
Capacity utilization rises in the month:
- The capacity utilization rate for the total manufacturing sector rose from 75.1% in December to 77.1% in January, mainly due to increased production.
- Significant increases were seen in the chemical (+7.5 percentage points) and transportation equipment (+3.7 percentage points) subsectors.
- These gains were partially offset by declines in the non-metallic mineral (-7.1 percentage points) and computer and electronic product (-6.1 percentage points) subsectors.
Canadian manufacturing sales rose by 0.2% in January 2024, falling short of the expected 0.4% growth. Despite this, some subsectors expanded, with transportation equipment and chemicals leading the way with advances of 4.3% and 3.5%, respectively. However, the aerospace products and parts industrial group experienced a large decline of -16.7%.
USD/CAD Live Chart
- Check out our free forex signals
- Follow the top economic events on FX Leaders economic calendar
- Trade better, discover more Forex Trading Strategies
- Open a FREE Trading Account
- Read our latest reviews on: Avatrade, Exness, HFM and XM
Related Articles


Sidebar rates
Related Posts
