Litecoin: Bullish Breakout or Bearish Pullback?
Litecoin (LTC), the "digital silver" to Bitcoin's gold, has had a rollercoaster ride in recent weeks. Here's a breakdown of the contrasting
•
Last updated: Tuesday, April 2, 2024
Litecoin (LTC), the “digital silver” to Bitcoin’s gold, has had a rollercoaster ride in recent weeks. Here’s a breakdown of the contrasting forces shaping LTC’s price:
Bullish Signs for Litecoin
- Strong Q1 Performance: March saw over 30 million LTC transactions, surpassing July 2023’s volume when LTC traded around $113. This suggests increased network activity.
- Commodity Classification Boost: The US CFTC classifying LTC as a commodity, alongside Bitcoin and Ethereum, has fueled investor optimism. Rumors of a potential Litecoin ETF further bolstered bullish sentiment.
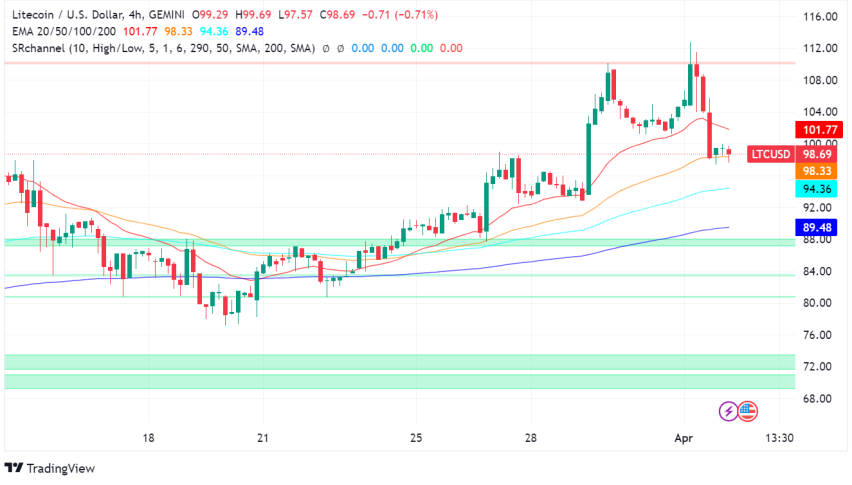
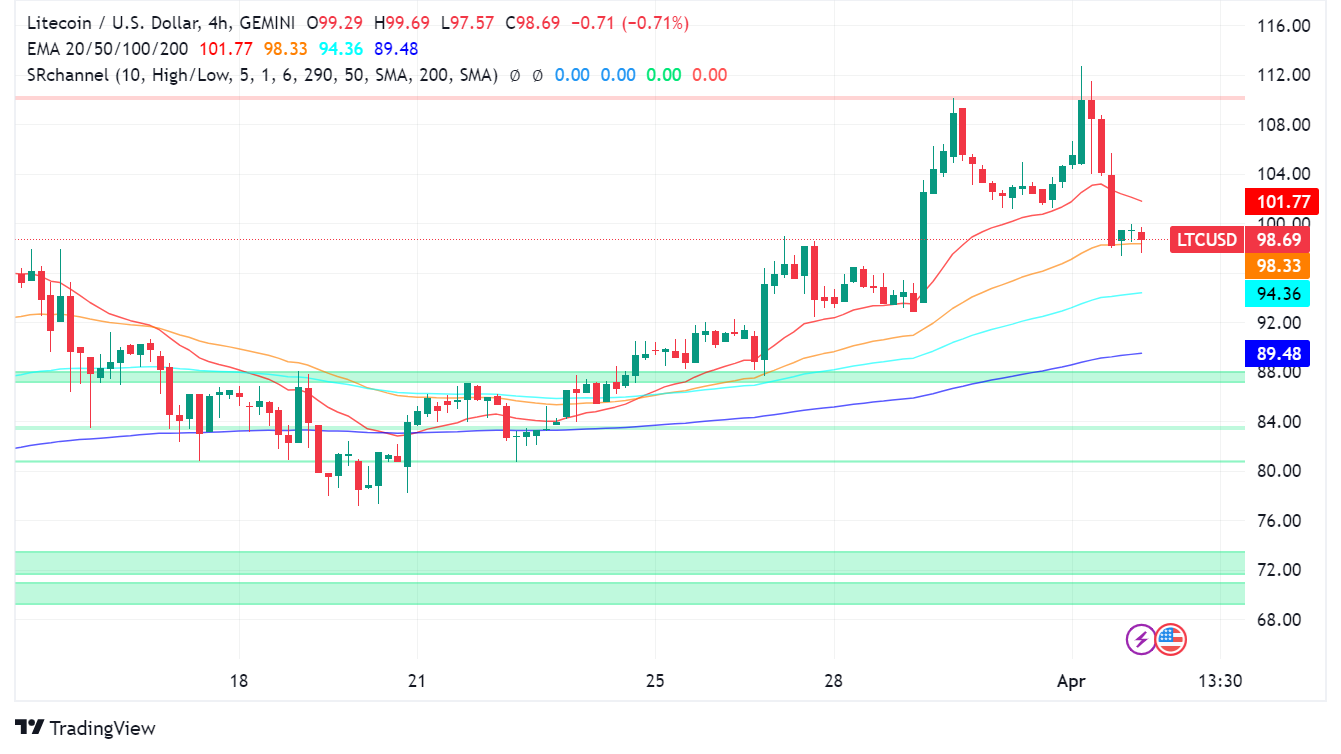
- Technical Analysis: Weekly and monthly charts indicate a bullish breakout from a long-term consolidation phase. Price targets range from $134 to even its all-time high if the momentum continues.
Bearish Concerns
- Weakening Correlation with Bitcoin: LTC’s historic correlation with Bitcoin seems to be weakening. This could lead to steeper losses for LTC if the trend continues.
- Declining Daily Active Addresses: A drop in DAA suggests fewer users on the network, potentially signaling a price correction.
- Technical Indicators: ADX and MACD indicators on daily charts hint at a downward trend, with a potential drop to $93 or even $80.
- Long-Term Downtrend: A two-year downtrend with lower highs indicates selling pressure and potential for further declines if LTC fails to break the resistance.
The Verdict?
Litecoin’s future hinges on several factors. Reclaiming the $100 level and a positive shift in the overall market sentiment are crucial for a bullish breakout. However, a drop below $100 could trigger a correction down to $90 or even $80, especially if Bitcoin continues its descent.
Long-Term Potential
Despite the short-term bearish outlook, a bounce off the $90 support level, coupled with a Bitcoin rally, could present a buying opportunity for long-term investors. In a highly bullish scenario, LTC could aim for $119, $150, or even $200, but this hinges on overcoming the current downtrend.
- Check out our free forex signals
- Follow the top economic events on FX Leaders economic calendar
- Trade better, discover more Forex Trading Strategies
- Open a FREE Trading Account
- Read our latest reviews on: Avatrade, Exness, HFM and XM
ABOUT THE AUTHOR
See More
Arslan Ali Butt
Lead Markets Analyst – Multi-Asset (FX, Commodities, Crypto)
Arslan Ali Butt serves as the Lead Commodities and Indices Analyst, bringing a wealth of expertise to the field. With an MBA in Behavioral Finance and active progress towards a Ph.D., Arslan possesses a deep understanding of market dynamics.
His professional journey includes a significant role as a senior analyst at a leading brokerage firm, complementing his extensive experience as a market analyst and day trader. Adept in educating others, Arslan has a commendable track record as an instructor and public speaker.
His incisive analyses, particularly within the realms of cryptocurrency and forex markets, are showcased across esteemed financial publications such as ForexCrunch, InsideBitcoins, and EconomyWatch, solidifying his reputation in the financial community.
Related Articles


Sidebar rates
Related Posts
