Forex Signals Brief April 3: Awaiting EU CPI Inflation and Powell’s Speech
Today traders are concentrated on the Eurozone CPI inflation and FED's Powell's speech in the evening.

The current market dynamics seem to be presenting a puzzling scenario, with mixed signals across different asset classes. While North American traders observed a breakout in Treasury yields, pushing the 10-year yields above the crucial 4.35% double top to reach 4.40%, the foreign exchange (FX) market did not follow suit. Instead, the US dollar faced pressure and declined throughout the day despite relatively positive economic indicators such as benign JOLTS data and indications from Fed officials suggesting the possibility of three rate cuts.

One particularly noteworthy observation is the strength of the Australian dollar (AUD) in comparison to stocks and bonds. This divergence has left market participants perplexed, prompting them to adopt a cautious stance as they await significant economic data releases scheduled for the end of the week. Key releases include the ISM services data on Wednesday and non-farm payrolls report on Friday. The strength of the euro (EUR) also caught attention, especially considering weaker German CPI data and the upcoming release of HICP data, which could potentially provide the European Central Bank (ECB) with justification for further monetary easing measures if needed.
Despite these factors, EUR/USD showed resilience, tracking to 1.0775 from 1.0725 with steady bids until the European market close, maintaining flat movement thereafter. Gold continued to attract investor interest, reaching a new record high. However, its journey was marked by volatility, with the price surging to $2278 before experiencing a $30 decline and subsequently rallying again to finish at the highs. Meanwhile, oil prices also demonstrated strength, with WTI oil closing above $85 for the first time since November, indicating optimism about the global economic recovery and potential supply constraints.
Today’s Market Expectations
The Eurozone Consumer Price Index (CPI) Year-over-Year (Y/Y) forecast suggests an increase to 2.6%, compared to the previous year’s figure of 2.6%. However, the Core CPI Y/Y measure is anticipated to decrease slightly to 3.0% from the previous year’s 3.1%. These projections indicate moderate inflationary pressures within the Eurozone, with core inflation slightly easing. Given the market’s current anticipation of the first rate cut in June, it’s unlikely that a significant deviation from these CPI forecasts would prompt immediate market repricing for an April move by the European Central Bank (ECB).
The projected ISM Services Purchasing Managers’ Index (PMI) for the United States is 52.6, which remains unchanged from the previous reading. Despite this projection, the recent S&P Global US Services PMI missed expectations slightly, slipping to a three-month low. However, the accompanying commentary from the report offered a generally positive outlook. According to the report, service providers indicated a slower pace of expansion, partially attributed to ongoing cost-of-living constraints. Despite this, there was optimism about the future, with confidence levels reaching a 22-month high in March.
The upcoming Joint Ministerial Monitoring Committee (JMMC) meeting scheduled for Wednesday will provide an opportunity for OPEC and its allies, collectively known as OPEC+, to discuss prevailing market dynamics. However, it’s widely anticipated that no policy recommendations will be made during this meeting. According to sources cited by Reuters on Tuesday, OPEC+ is unlikely to make any adjustments to its output policy until the June summit. This suggests that the group intends to maintain its current production levels in the near term. However, it’s worth noting that OPEC+ has a history of announcing policy changes outside of scheduled meetings if deemed necessary. Therefore, despite the lack of policy adjustments expected at the JMMC meeting, market participants will remain vigilant for any unexpected announcements. Additionally, recent reports indicate that Russia has instructed its oil companies to reduce output to 9 million barrels per day (BPD) by the end of June in compliance with its OPEC+ commitments. This move underscores Russia’s commitment to adhering to the agreed-upon production levels within the OPEC+ framework.
Yesterday the price action was average, with the USD going through a retrace afgtter advancing higher on Monday following the US ISM manufacturing. We opened several trading signals during the day, but only two of them closed in profit in the European session, one winning and one losing trades in total.
Gold Puts in Place A New High
The recent movements in the price of gold reflect strong purchasing activity and investor interest in the precious metal. GOLD rallied significantly, reaching a high of $2,265, and there’s a target price of $2,500 in sight. Despite a temporary dip to $2,228, the price quickly rebounded above $2,250, indicating robust buying interest even after minor downturns. This resilience suggests that buyers are keen to step in and support the market whenever there’s a pullback, highlighting the underlying strength of the bullish sentiment for gold. Yesterday, gold prices continued their upward trajectory, reaching a new high of $2,280. This further reinforces the bullish momentum in the gold market and underscores the sustained demand for the precious metal as a safe-haven asset and hedge against economic uncertainties.
XAU/USD – 60 minute chart
NZD/USD Closes the Week Below 0.60
Moving averages are acting as resistance suggests that there is selling pressure building up in the market. Additionally, the break of the 0.60 level is a significant technical event that points to a negative outlook for the pair. The expectation of lower volatility further supports the notion of a continued downward trend for the NZD/USD pair. This lower volatility may indicate a lack of strong bullish momentum, which could pave the way for further declines. The completion of a recent upward retracement adds to the bearish sentiment, suggesting that the temporary upward movement has run its course and that the pair is likely to resume its downward trajectory. Based on this analysis, opening a sell position on the NZD/USD pair could be a strategic decision, aligning with the overall bearish outlook indicated by the technical indicators.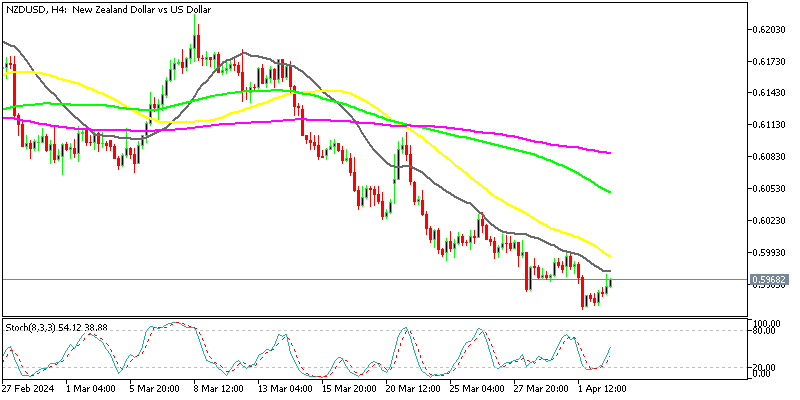
NZD/USD – H4 Chart
Cryptocurrency Update
Bitcoin Dips to $65,000
The struggle to maintain the price above $70,000 could indeed signal a near-term high for BITCOIN . This level may be acting as a significant resistance point, indicating a potential exhaustion of bullish momentum. If buyers are unable to sustain prices above this level, it may suggest weakening demand and a possible shift in sentiment. The observation of a bearish reversal pattern on the daily chart further supports the notion of a potential price reversal. Bearish reversal patterns often indicate a transition from a bullish to a bearish market sentiment, typically preceding price declines. If this pattern is confirmed, it could signal a short-term downturn in Bitcoin’s price.
BTC/USD – Daily chart
The 50 SMA Continues to Hold for Ethereum
Ethereum found firm support at the 50-period SMA suggests that this technical level is significant in determining price movements. The bounce from this level indicates that buyers are willing to enter the market and support Ethereum’s price when it approaches the 50-period SMA. However, ETHEREUM has encountered resistance near the 20-period SMA, which is limiting further upward movement. The fact that the 20-period SMA is acting as resistance suggests that there may be selling pressure or a lack of sufficient bullish momentum at this level to push Ethereum’s price higher. yesterday we saw a bearish reversal which sent the price toward $3,000.
ETH/USD – Daily chart
- Check out our free forex signals
- Follow the top economic events on FX Leaders economic calendar
- Trade better, discover more Forex Trading Strategies
- Open a FREE Trading Account
- Read our latest reviews on: Avatrade, Exness, HFM and XM
Related Articles


Sidebar rates
Related Posts
