CAC Extends Rally but Fails to Place a New All-Time High
Stocks got a boost yesterday from a decline in US inflation, the French stock index climbed from its low yesterday to close flat on the day.


Stocks got a boost yesterday from a decline in US inflation, the French stock index climbed from its low yesterday to close flat on the day.
Stock markets were expecting the decline seen in US inflation yesterday. It was enough to spur global socks higher. As mentioned previously, stock markets saw their perception of a likely US rate cut confirmed by the data.
The CAC was no exception as it recovered from 8203 to close at 8242 yesterday, a rally of 0.47%. Today the CAC has lost all its gains from yesterday, I see a lot of profit taking and the failure to reach new highs.
Stocks paying the largest price in today’s sell off:
- Stellantis -1.80%
- Michelin -1.31%
- Renault -1.12%
- Schneider -1.10%
Technical View
The day chart below for the CAC shows an ongoing bullish trend that has failed to break past the previous all-time high. The ATH was set on April 2, at 8261, yesterday’s candle just fell short of that level at 8254.
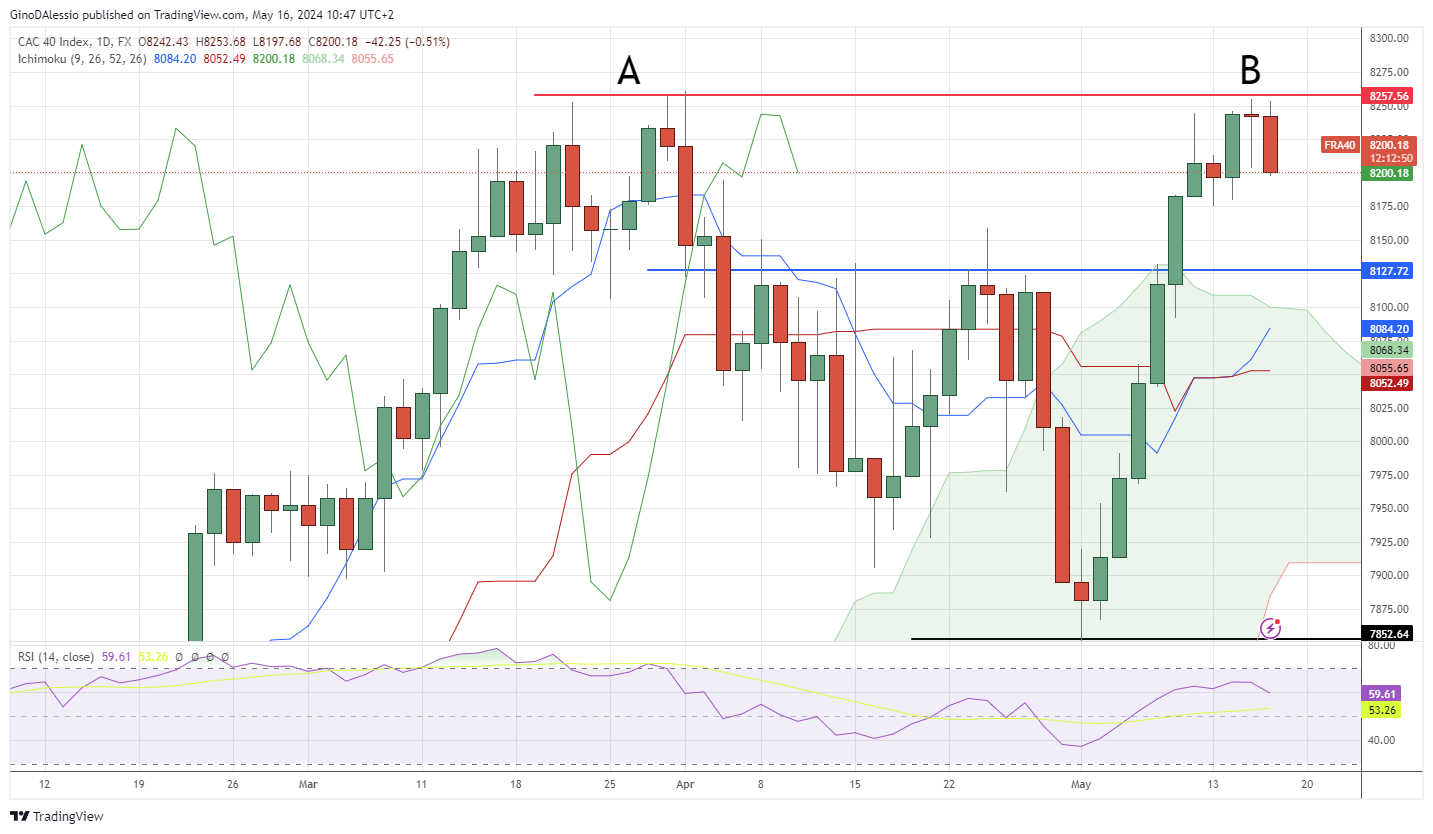
That candle also created a hammer, which together with the previous candle and today’s candle would create a pattern that indicates a reversal. We still need to wait for the day’s close to confirm the red candle.
However, it looks likely to close red and should lead to a correction. Looking at the day chart more broadly we can see a double top formed between points A and B. The next support area is at the level of 8127 (blue line).
If that level were to be broken the market would find support from the cloud, between 8100 and 7900. For the bull trend to continue its rally we would need to see a close above the ATH of 8261.
- Check out our free forex signals
- Follow the top economic events on FX Leaders economic calendar
- Trade better, discover more Forex Trading Strategies
- Open a FREE Trading Account
- Read our latest reviews on: Avatrade, Exness, HFM and XM
Related Articles


Sidebar rates
Related Posts
