EURUSD Tests Resistance After Disappointing ISM Manufacturing
EURUSD has jumped 60 pips higher in the US session after the soft ISM manufacturing, testing the 1.09 level again.
EURUSD has jumped 60 pips higher in the US session after the soft ISM manufacturing, testing the 1.09 level again. This resistance zone has been rejecting the Euro several times before, but the price keeps coming back here, despite the ECB preparing to start the monetary easing process on Thursday, with a 25 bps rate cut on the agenda.
The ISM Manufacturing data for May reflects a challenging environment for the manufacturing sector, with several indicators pointing to weaker demand and production. The significant drop in new orders is particularly concerning as it may signal further contraction in the months ahead. However, the expansion in employment and new export orders offers some positive notes. The easing in prices paid suggests that inflationary pressures are subsiding, which could provide some relief for manufacturers.
EUR/USD Chart H4 – Knocking on 1.09 Again

Last week the Eurozone’s inflation figures came in higher than expected. In response to the news, the Euro strengthened, with EUR/USD rising to 1.0850, up from 1.0820. However ECB members indicated that they may maintain their monetary policy stance despite inflationary pressures.
So, EUR/USD retreated back down, but moving averages which have turned into support held again and today buyers are back, with the price testing the resistance zone after the US ISM manufacturing and manufacturing prices, both of which were weaker than expectations.
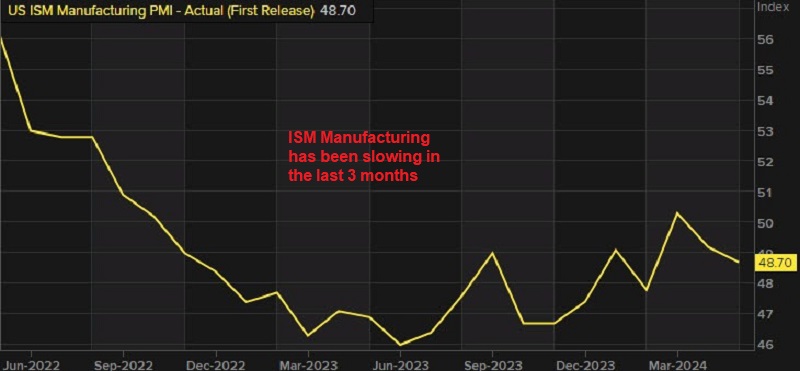
US ISM Manufacturing for May 2024
- Headline ISM Manufacturing Index: 48.7 vs 49.6 estimate (Prior: 49.2). The drop to 48.7 signals ongoing contraction in manufacturing activity as it remains below the 50 threshold, which separates expansion from contraction. The decline to 57.0 from 60.9 last month suggests that inflationary pressures are easing, although prices are still rising.
- Prices Paid: 57.0 vs 58.5 estimate (Prior: 60.9). The increase to 51.1 from 48.6 indicates that employment in the manufacturing sector is expanding.
- Employment: 51.1 vs 48.6 last month. The significant drop to 45.4 from 49.1 is a worrying sign, indicating a decrease in demand for manufactured goods.
- New Orders: 45.4 vs 49.1 last month. The slight drop to 50.2 from 51.3 shows a modest deceleration in production activity.
- Production: 50.2 vs 51.3 last month. Remained unchanged at 48.9, indicating faster delivery times.
- Supplier Deliveries: 48.9 vs 48.9 last month. The slight decline to 47.9 from 48.2 suggests that manufacturers are reducing inventory levels.
- Inventories: 47.9 vs 48.2 last month. The drop to 42.4 from 45.4 indicates a reduction in the order backlog, implying weaker future production activity.
- Backlog of Orders: 42.4 vs 45.4 last month. The increase to 50.6 from 48.7 is a positive sign, suggesting improved demand from international markets.
- New Export Orders: 50.6 vs 48.7 last month. The slight decline to 51.1 from 51.9 indicates a reduction in import activity, but still above the 50 threshold, showing expansion.
EUR/USD Live Chart
- Check out our free forex signals
- Follow the top economic events on FX Leaders economic calendar
- Trade better, discover more Forex Trading Strategies
- Open a FREE Trading Account
- Read our latest reviews on: Avatrade, Exness, HFM and XM