EUR/USD Eurozone Flash Manufacturing PMI Shows Unexpected Decline
The Eurozone Flash Manufacturing PMI declined to 45.6, the forecast was for a small increase to 47.9 compared to last month’s 47.3.


The Eurozone Flash Manufacturing PMI declined to 45.6, the forecast was for a small increase to 47.9 compared to last month’s 47.3.
The Flash Composite PMI remained above 50 at 50.8, another large decline from last month’s 52.2. The Services PMI is the component that kept the Composite above 50, printing at 52.6 compared to last month’s figure of 53.2.
The euro rally at the start of the week was fueled by the sentiment of a decreasing dovish stance by the ECB. However, the Fed’s likelihood of keeping rates higher for longer has predominated market opinion leading to lower EUR/USD over the last 2 sessions.
The focus now turns to next week’s data from the US. Next Thursday we will get GDP Growth Q1 and Durable Goods Orders MoM. While next Friday we have inflation data for PCE, the Fed’s favorite index for gauging price pressure, and consumer confidence.
Both durable goods and GDP growth are expected to decline considerably. The data, if confirmed, could create expectations that the Fed may see more reasons to start implementing monetary easing.
However, as the Fed has stated many times, inflation is the key data to establish their policies, and PCE is the main element of inflation gauges that they consider. So, we’ll likely get a lot of volatility on the PCE release if there’s an unexpected number.
Technical view
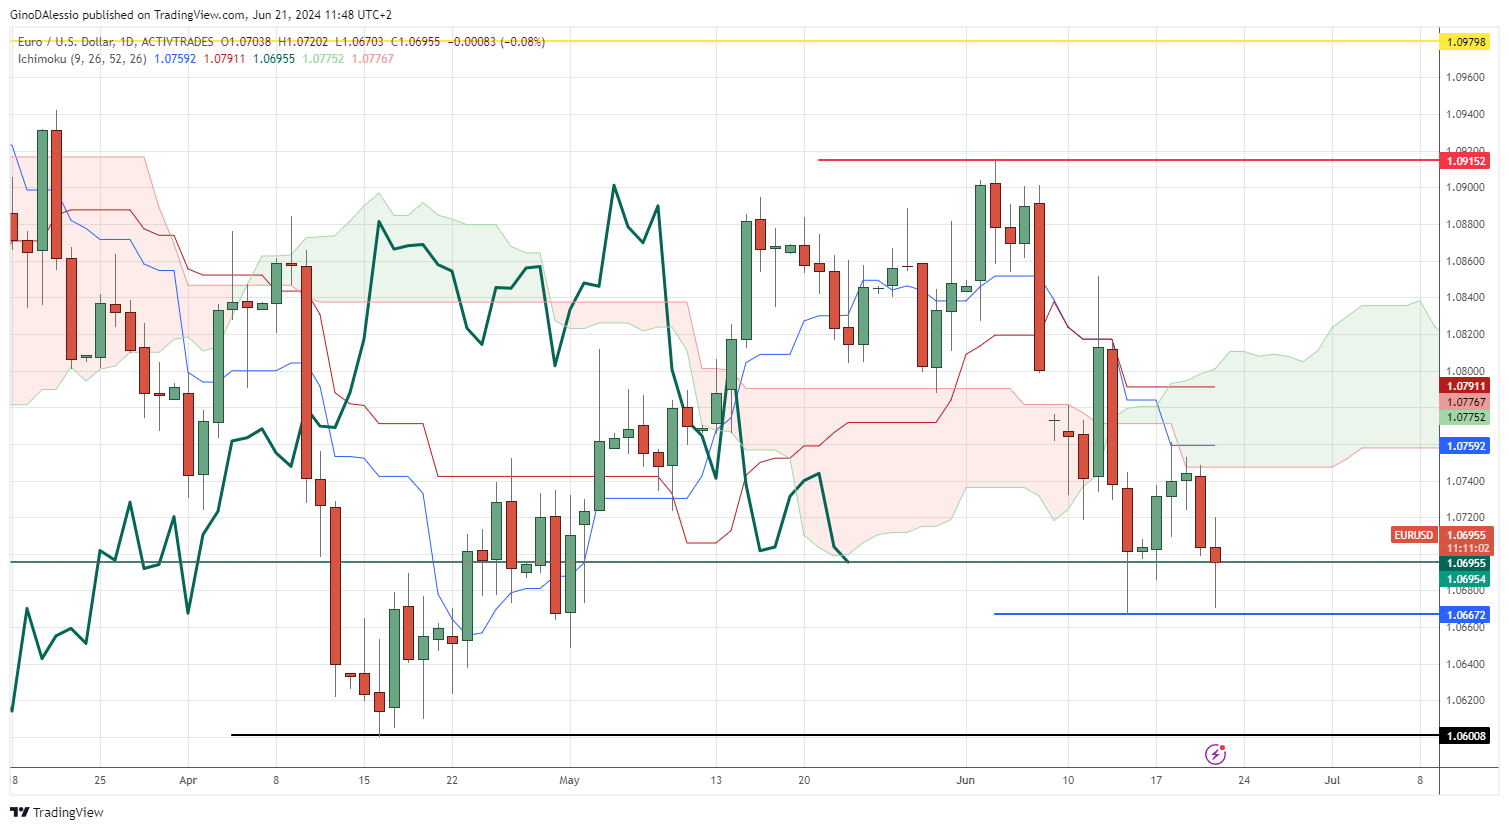
The day chart below for the EUR/USD shows a market that may have technically entered a bear trend according to the Ichimoku system. If today’s candle closes in the red around this level, the final element of the system would be fulfilled.

The last element is the lagging line (dark green), which also needs to close below the Ichimoku cloud to complete the signal. A close below the support of 1.0692 (light green line) would give further indications of a bearish trend.
The next support level would be the recent low of 1.0667 (blue line). Should that break, the next support level is at 1.0600 big figure, which also coincides with the dip of the previous bearish leg on April 16.
- Check out our free forex signals
- Follow the top economic events on FX Leaders economic calendar
- Trade better, discover more Forex Trading Strategies
- Open a FREE Trading Account


