Bitcoin Price Faces Selling Pressure as Hodlers Take Profits
Bitcoin (BTC) is experiencing potential selling pressure as long-term holders appear to be taking profits, according to recent research.
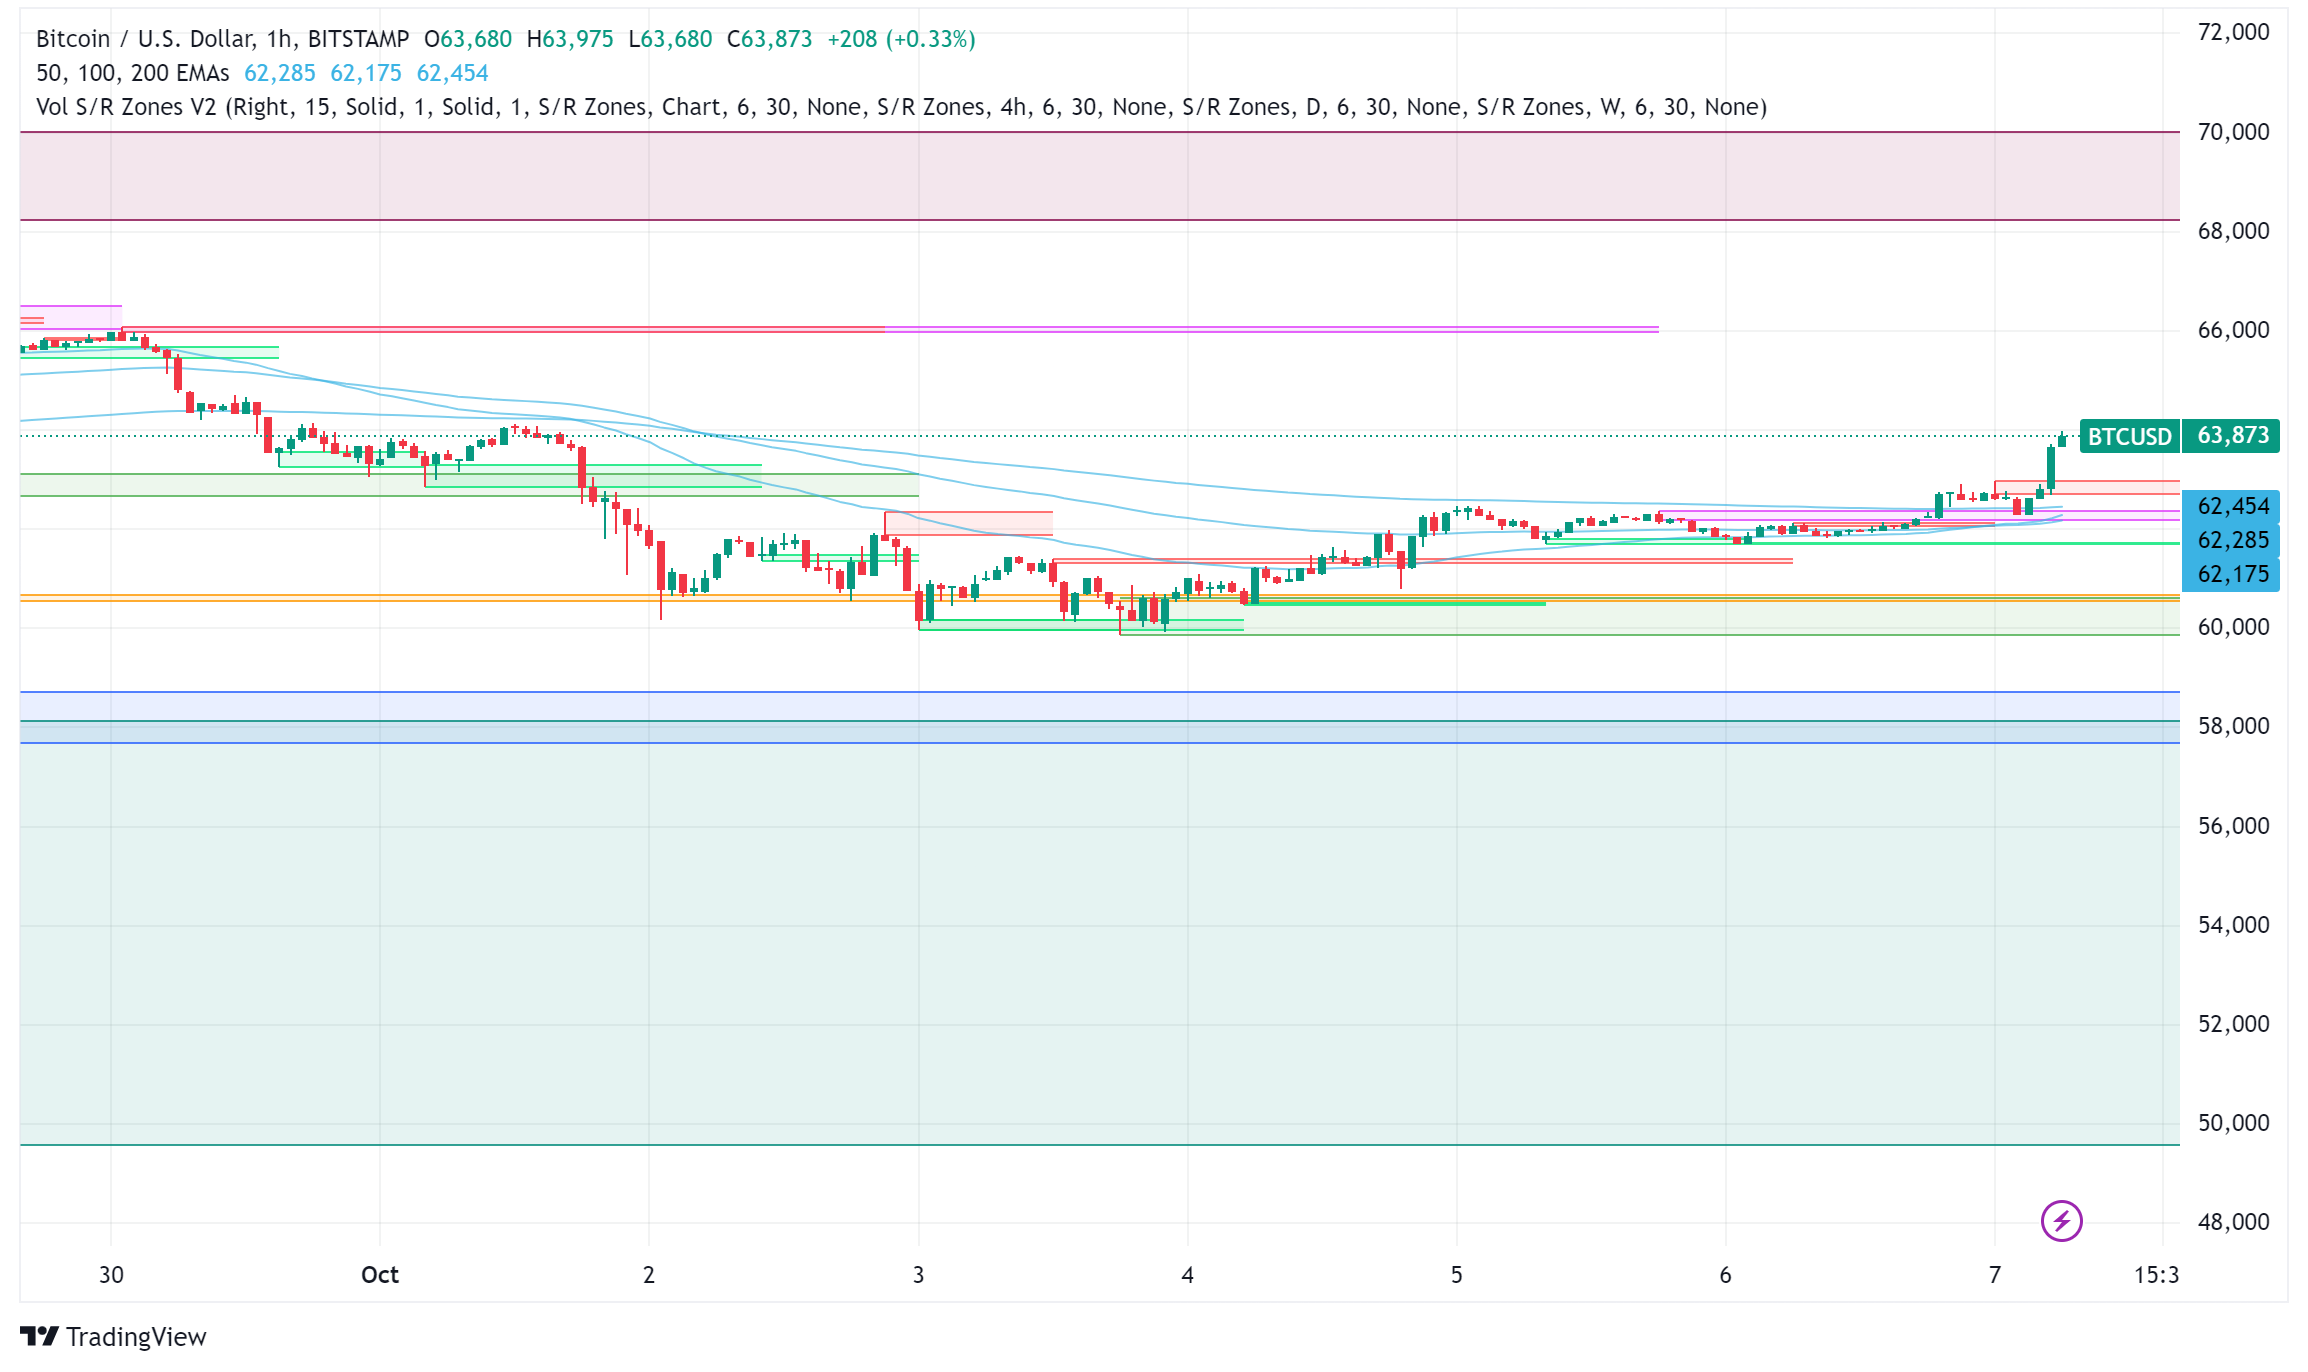
Bitcoin (BTC) is experiencing potential selling pressure as long-term holders appear to be taking profits, according to recent research. The leading cryptocurrency was trading at $63,800 at the time of writing, down from its all-time high of over $73,000 reached in March.
Long-Term Holders Reduce Exposure While Speculators Step In
New data from on-chain analytics platform CryptoQuant reveals a shift in investor behavior, with long-term holders (LTHs) reducing their exposure while short-term speculators increase their positions. CryptoQuant contributor Amr Taha noted a “sharp decrease of $6 billion” in the realized cap of LTHs, defined as those holding Bitcoin for 155 days or more. This suggests that seasoned investors are likely taking profits or closing buying positions.
In contrast, short-term holders (STHs) seem to be taking on more risk. The STH realized cap has seen a recent increase of $6 billion, indicating that these newer investors are increasing their buying positions.
Spot Bitcoin ETFs See Outflows Amid Market Uncertainty
Adding to the bearish sentiment, US spot Bitcoin ETFs opened the fourth quarter of 2024 with over $300 million in weekly outflows. This development coincided with Bitcoin’s decline of more than 6% in the first five days of October. Despite this setback, spot Bitcoin ETFs still hold a significant portion of the circulating supply, representing 4.68% of the market with total net assets valued at $57.73 billion.
BTC/USD Technical Indicators Point to Potential Further Decline
The research also highlighted a close interaction between Bitcoin’s spot price and the realized price of coins moving between one day and one week ago. At the time of writing, this “hottest” part of the BTC supply had a realized price of $62,080, nearly identical to the spot price. Taha suggested that this could imply weakening momentum and potential short-term corrections.
Technical analysis paints a gloomy picture for Bitcoin’s near-term prospects. The 200-day Simple Moving Average (SMA) is indicating a bearish trend, with some analysts predicting a potential drop to $40,000. This week’s chart shows a 7.1% decline, further fueling investor concerns.
- Check out our free forex signals
- Follow the top economic events on FX Leaders economic calendar
- Trade better, discover more Forex Trading Strategies
- Open a FREE Trading Account
- Read our latest reviews on: Avatrade, Exness, HFM and XM
Related Articles


Sidebar rates
Related Posts
