Gold Price Climbs to $2,657 Amid Fed Rate Cut Expectations and Geopolitical Risks
Gold (XAU/USD) rose to the $2,657-2,658 range during early trading after reversing a dip seen in the Asian session.

Gold (XAU/USD) rose to the $2,657-2,658 range during early trading after reversing a dip seen in the Asian session.

The positive momentum is attributed to a favorable inflation outlook following the US Producer Price Index (PPI) report. The PPI figures suggest a deceleration in price increases, supporting market expectations that the Federal Reserve will cut interest rates further in November.
🚨 #BreakingNews 🚨
Gold surges as mixed US economic data fuels speculation of an upcoming Fed rate cut! Investors are flocking to the safe-haven asset, driving prices higher amid increased uncertainty over future monetary policy decisions. Will gold continue to shine as the…— BullRush (@Bullrushcomp) October 12, 2024
According to the US Bureau of Labor Statistics, the headline PPI for September rose 1.8% annually, with the core index climbing 2.8%. These figures, while slightly higher than expected, indicate easing inflationary pressures, allowing the Fed more flexibility in its monetary policy. CME Group’s FedWatch Tool indicates that markets are now pricing in a 90% probability of a 25 basis point rate cut in November, lending support to gold prices.
Moreover, rising geopolitical tensions in the Middle East further increase demand for the safe-haven precious metal, as investors seek refuge from heightened global risks.
The Role of US Treasury Yields and Dollar Strength
Despite gold’s rise, the rally is somewhat capped by elevated US Treasury yields and a strong US Dollar (USD). The yield on the 10-year US Treasury bond remains above 4%, as the possibility of aggressive monetary policy easing by the Fed diminishes. This keeps the USD near its two-month high, limiting gold’s upside potential. The correlation between Treasury yields and gold is a significant driver, as higher yields make non-yielding assets like gold less attractive.
However, the lack of an aggressive rate-cutting stance by the Fed also leaves room for bullish momentum in gold, especially given the growing concerns surrounding global economic conditions.
$SPY $SPX $NDX $QQQ $DIA $DJT, including $BTC, gold, and real estate—everything’s a bubble, and yet the Fed decides to cut rates by 50bp with markets sitting at all-time highs! CPI came 🔥 🔥 🔥, unemployment’s rising, but sure, let’s add more fuel to the fire with another rate…
— Sebastián (@SebastinPatron3) October 14, 2024
Technical Outlook: Key Price Levels for Gold
From a technical perspective, gold maintains a bullish bias as long as it remains above the pivot point at $2,646.80. Buyers have been able to push prices toward immediate resistance at $2,670.20. A breakout above this level could propel gold further to the next resistance levels of $2,685.39 and $2,698.84.
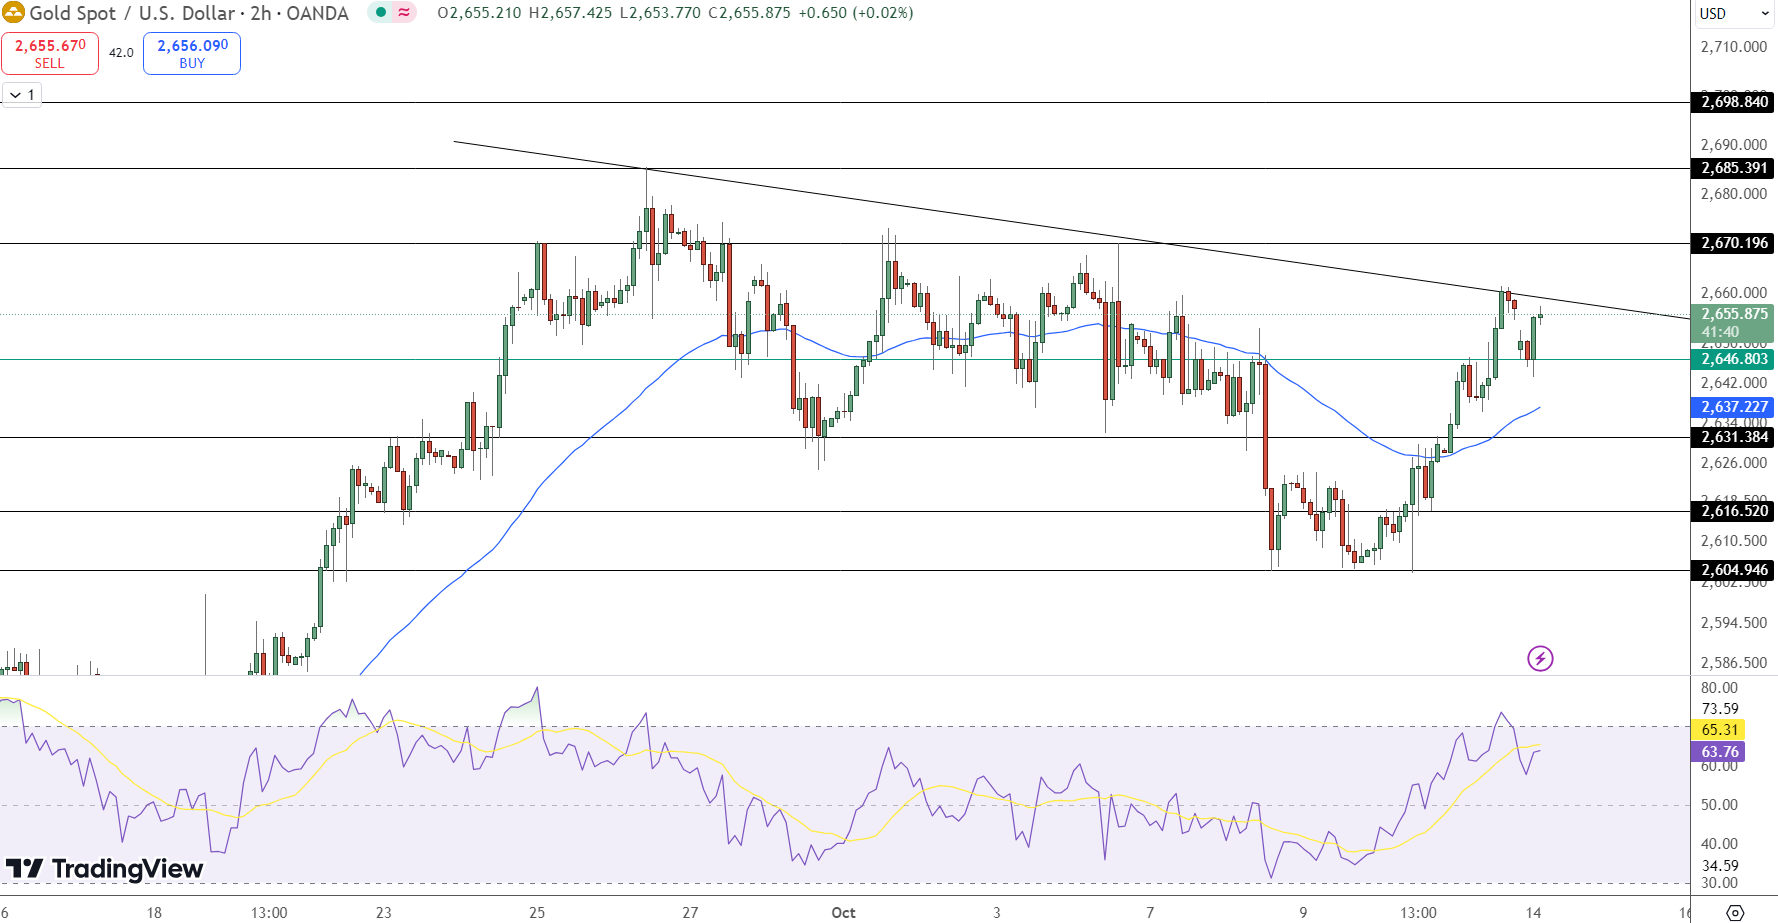
Conversely, should gold fail to break through resistance, immediate support can be found at $2,637.23. Further downside could see the precious metal test lower support levels at $2,631.38 and $2,616.52. The RSI indicator currently stands at 65.31, suggesting bullish momentum, though nearing overbought territory, which could temper gains in the short term. Additionally, the 50-day EMA at $2,646.80 reinforces the pivot point as a critical support zone.
Key Insights:
-
Gold price rises to $2,657 amid expectations of a Fed rate cut.
-
US Treasury yields remain elevated, capping gold’s upside.
-
Immediate resistance at $2,670.20, with support at $2,637.23.
- Check out our free forex signals
- Follow the top economic events on FX Leaders economic calendar
- Trade better, discover more Forex Trading Strategies
- Open a FREE Trading Account
- Read our latest reviews on: Avatrade, Exness, HFM and XM
Related Articles


Sidebar rates
Related Posts
