Gold Hits $2,700; Softer Inflation Sparks Fed Rate-Cut Hype
Gold prices stabilized near $2,697 on Thursday, maintaining their highest levels in over a month. This bullish momentum was fueled ...

Gold prices stabilized near $2,697 on Thursday, maintaining their highest levels in over a month.

This bullish momentum was fueled by softer U.S. core inflation data, which raised hopes for Federal Reserve rate cuts. Core inflation cooled unexpectedly, with headline consumer prices showing no significant spikes, according to data released on Wednesday.
The Fed’s potential easing of monetary policy is viewed as a key driver for gold, as lower interest rates reduce the opportunity cost of holding non-yielding assets. “The prospect of disinflation supports bullion demand as markets anticipate a less restrictive monetary policy,” stated Jigar Trivedi, senior analyst at Reliance Securities.
Dollar Weakness and Bond Yields Add Momentum
The U.S. dollar slid against major currencies, retreating from recent highs as cooling inflation weighed on bond yields. This decline in yields added further support for gold, with investors betting on near-even odds of two Fed rate cuts by year-end, starting as early as June. Futures markets have increasingly priced in dovish central bank moves following the inflation report, amplifying the allure of gold.
However, gains were tempered by geopolitical developments, including a ceasefire agreement between Israel and Hamas. This eased some risk-off sentiment, capping gold’s upward trajectory.
Technical Outlook: Gold Eyes $2,700 Breakout
Gold remains bullish, holding above the key pivot point of $2,685. Immediate resistance lies at $2,702, with further targets at $2,718 and $2,731. On the downside, immediate support is seen at $2,678, followed by $2,669.
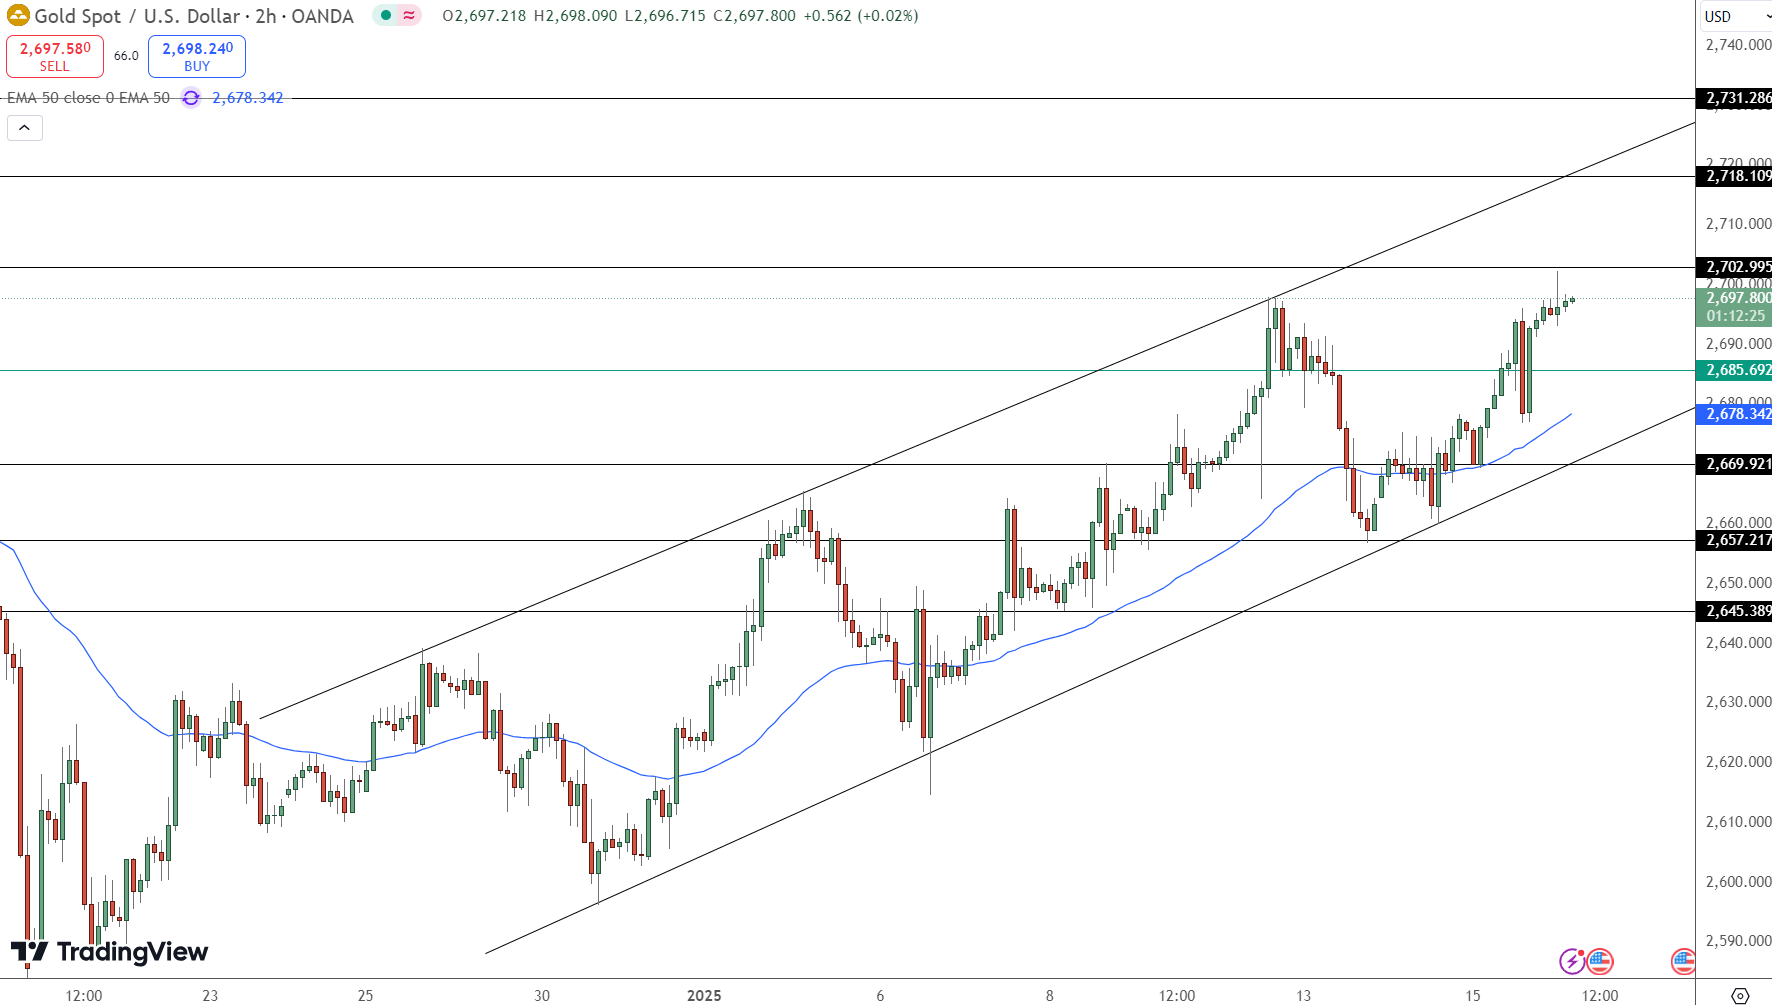
Technical indicators support the positive trend, with the 50-day EMA at $2,678 offering solid near-term backing. Additionally, a bullish engulfing candle on the 2-hour chart underscores buyer strength. However, traders should monitor resistance zones for consolidation risks as overbought conditions emerge.
- Check out our free forex signals
- Follow the top economic events on FX Leaders economic calendar
- Trade better, discover more Forex Trading Strategies
- Open a FREE Trading Account
- Read our latest reviews on: Avatrade, Exness, HFM and XM
Related Articles


Sidebar rates
Related Posts
