Gold Price Forecast: $3,295 in Sight as NFP and Trade Talks Take Focus
Gold is hovering around $3,255 as traders await U.S. NFP, unemployment data and a potential break above $3,262.
Quick overview
- Gold is currently priced around $3,255 as traders await key U.S. jobs data, including Non-Farm Payrolls and unemployment figures.
- Optimism surrounding U.S.-China trade talks is reducing safe-haven demand for gold, contributing to a recent price decline.
- The critical resistance level to watch is $3,262, with potential targets for a breakout set at $3,276 and $3,295.
- Analysts suggest that any unexpected downside in the jobs report could be bullish for gold, while strong numbers may pressure prices.
Gold is hovering around $3,255 as traders await U.S. NFP, unemployment data and a potential break above $3,262. Trade talk optimism is killing safe-haven demand. All eyes are on the 12:30pm ET U.S. jobs report today which includes three key releases: Non-Farm Payrolls (forecast: 138K vs. previous 228K), Unemployment Rate (steady at 4.2%) and Average Hourly Earnings (expected at 0.3%). The numbers may impact gold’s next move especially as investors assess if the Fed has room to ease later this year.
With inflation moderating and the labor market slowing, any downside surprise could be gold positive. Conversely a strong number could reignite higher for longer rates and pressure gold.
Gold Retreats on Risk Sentiment and China Holiday
Gold fell to a two week low today as U.S.-China trade tensions ease. President Trump expressed optimism on trade deals with China, India and Japan. Reports also suggest the U.S. has approached Beijing to reopen tariff talks. With Chinese markets closed for Labor Day, safe-haven flows into gold have dried up.
Analysts like Bob Haberkorn of RJO Futures say profit taking is the reason traders are moving into risk assets. Meanwhile Fed officials reiterated they won’t adjust rates until inflation declines or employment deteriorates.
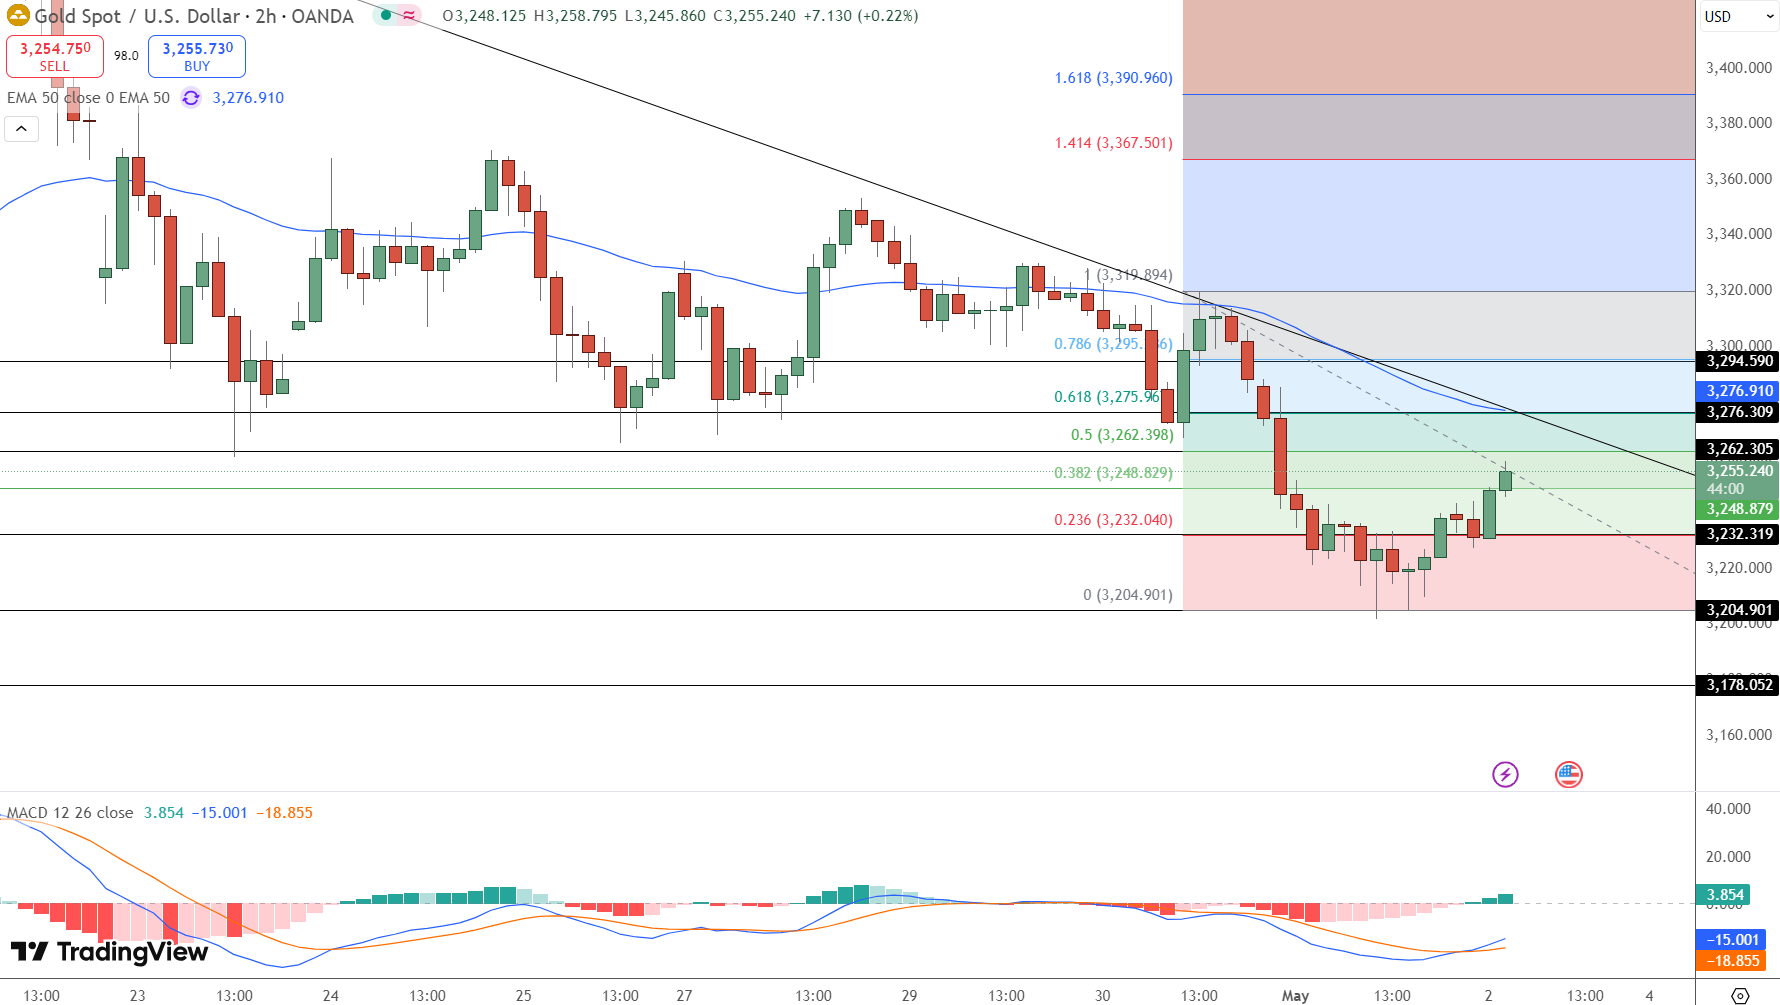
Gold Technical Outlook: Watch $3,262
Gold (XAU/USD) is trying to rebound from $3,232 supported by the 0.382 Fibonacci level of the April correction. Price is currently at $3,255 and testing the confluence around $3,262 which includes:
-
50-period EMA: $3,276
-
Descending trendline resistance
MACD is still bearish but showing signs of recovery.
Trade Setup:
-
Buy: Break above $3,262 with volume
-
Targets: $3,276, $3,295
-
Stop Loss: Below $3,232
A rejection at resistance could lead to a pullback to $3,205. Wait for confirmation before entering especially ahead of high impact NFP.
Key Takeaways:
-
U.S. jobs data will be the next big mover* Trade talk optimism killing safe-haven demand
-
$3,262 is the level to watch for short term reversal
Be ready. Macro and technicals are aligning.
- Check out our free forex signals
- Follow the top economic events on FX Leaders economic calendar
- Trade better, discover more Forex Trading Strategies
- Open a FREE Trading Account