GBP/USD on the Back Foot—Dollar Strength Sparks Selloff
The GBP/USD is falling against the dollar, down to 1.3160 in the European session. This is as the dollar is gaining on the back...
Quick overview
- The GBP/USD is declining to 1.3160 as the dollar strengthens due to a US-China trade deal and a rate cut by the Bank of England.
- The Bank of England has reduced interest rates by 25 basis points to 4.25%, adding pressure on the pound.
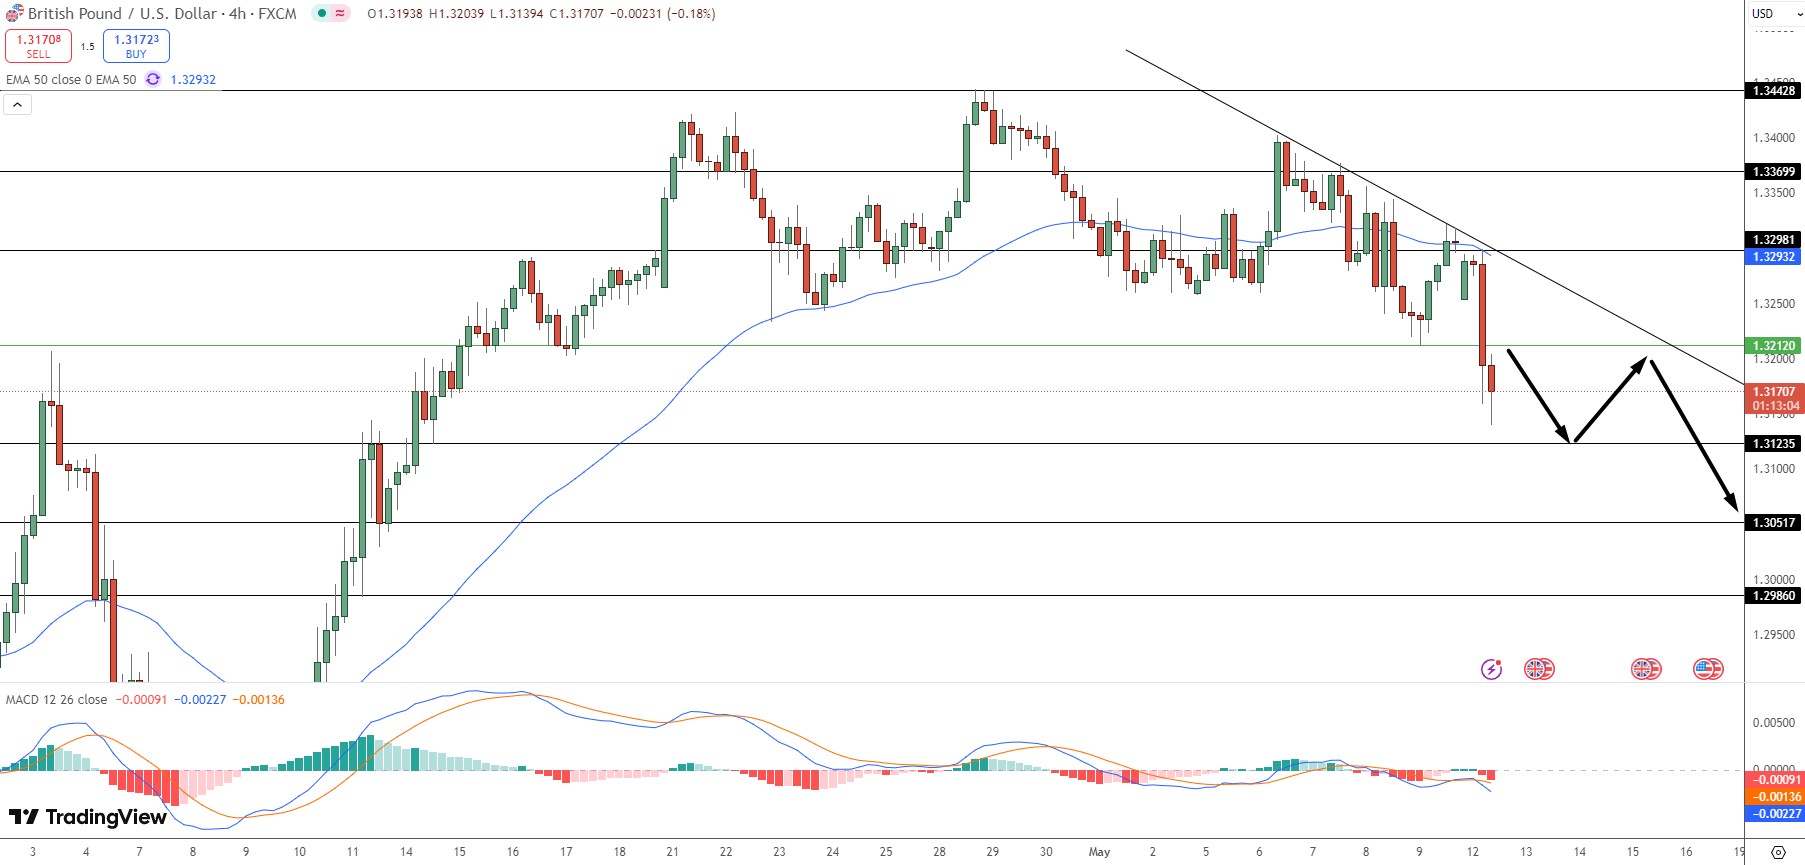
- Technically, GBP/USD is struggling to maintain levels above $1.3212, with key resistance at $1.3293 and support at $1.3123.
- Upcoming economic data from the UK labor market and US inflation will be crucial for determining the currency pair's direction.
The GBP/USD is falling against the dollar, down to 1.3160 in the European session. This is as the dollar is gaining on the back of a US-China trade deal and the Bank of England’s rate cut. The BoE cut interest rates by 25 basis points to 4.25% and that’s putting extra pressure on the pound which has been struggling to hold against a resurgent dollar.
Several things are weighing on the GBP/USD:
-
US-China Trade Deal: The US and China have reached a deal, they will reduce tariffs on each other’s goods. This 90 day tariff reduction period starts on Wednesday and is seen as a big step towards stabilising global trade. US Treasury Secretary Scott Bessent said both countries will cut tariffs by 115% which is a big relief for global supply chains and is supporting the dollar’s recent gains.
-
BoE Rate Cut: The Bank of England’s rate cut to 4.25% is adding to the pound’s downside, some policymakers are concerned about long term inflation risks. But Chief Economist Huw Pill is downplaying the impact of the US-China deal on the UK economy and is focusing on domestic factors.
Technical Analysis: GBP/USD Faces Key Support Levels
Technically the GBP/USD is under pressure and struggling to hold above $1.3212 after falling from $1.3298. The 50 day EMA at $1.3293 is now acting as resistance and the recent break below this level suggests the downtrend will continue. The MACD is confirming the selling pressure as the histogram turns red.
Key levels to watch:
-
Immediate Resistance: $1.3212
-
Next Resistance: $1.3298
-
Immediate Support: $1.3123
-
Next Support: $1.3051
Technical Indicators:
-
50 EMA: $1.3293 (Bearish, acting as resistance)
-
MACD: Bearish crossover, momentum building
-
RSI: Approaching oversold, potential for short term bounce
GBP/USD Outlook – May 2025
Watch out for economic data this week, UK labor market and US inflation numbers. A break below $1.3123 will confirm the downside to $1.3051, above $1.3212 will be a short term bounce. But as long as below the 50 day EMA the trend is bearish.
- Check out our free forex signals
- Follow the top economic events on FX Leaders economic calendar
- Trade better, discover more Forex Trading Strategies
- Open a FREE Trading Account