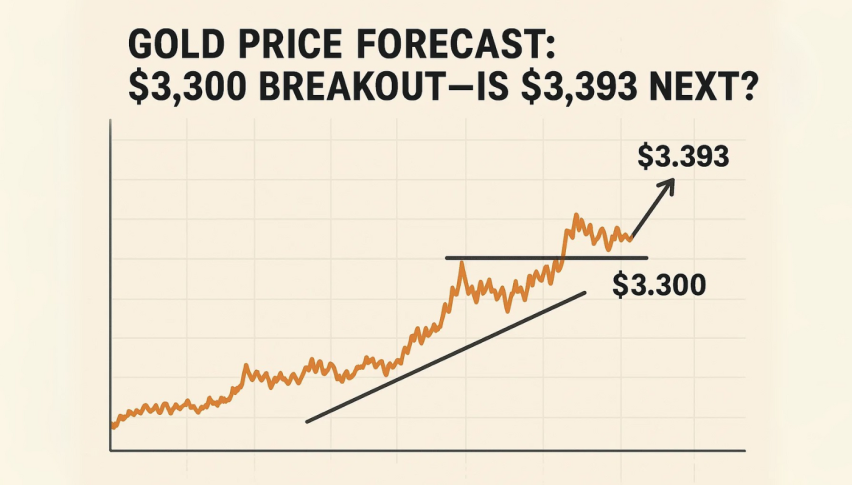
Gold Price Forecast: $3,300 Breakout—Is $3,393 Next?
Gold surged past $3,300 on Wednesday, hitting its highest level in over a week as the U.S. Dollar slipped to its lowest point since May 7.
Quick overview
- Gold prices surged past $3,300, reaching a peak not seen in over a week due to a weakening U.S. Dollar.
- The decline in the dollar is attributed to fiscal uncertainty in Washington and a recent credit downgrade by Moody's.
- Analysts maintain a bullish outlook on gold, with potential targets of $3,348 and $3,393 if current momentum continues.
- Gold's technical breakout signals further upside, supported by a favorable macroeconomic environment.
Gold surged past $3,300 on Wednesday, hitting its highest level in over a week as the U.S. Dollar slipped to its lowest point since May 7. The catalyst? Renewed fiscal uncertainty in Washington, where President Trump’s ambitious tax bill faces resistance from within his own party.
Moody’s recent U.S. credit downgrade and growing skepticism about the bill’s feasibility have weighed on the greenback. “The general dollar index lost more than a full point in the last 24 hours,” noted Marex’s Edward Meir, adding that the shift is giving gold an extra boost as a safe-haven asset.
A weaker dollar makes dollar-denominated gold cheaper for foreign buyers, boosting demand. Historically, gold also thrives in low-rate, high-uncertainty environments—exactly the kind of backdrop that’s unfolding now in U.S. politics and monetary policy.
Analyst Sentiment Supports Gold Upside
Despite short-term noise around potential trade deal headlines, many analysts maintain a bullish medium-term outlook on gold. Tim Waterer, Chief Market Analyst at KCM Trade, suggests that gold could reclaim the $3,500 zone if macro risks persist.
Meanwhile, St. Louis Fed President Alberto Musalem struck a cautious tone, stating that easing trade tensions could help inflation meet the Fed’s 2% target. That would reduce pressure for rate hikes and potentially support gold’s ongoing rally.
While the market watches for clarity on both tax reform and Fed guidance, the momentum is clearly in gold’s favor.
Gold Technical Breakout Signals More Upside
Gold’s technical breakout is hard to ignore. The metal pushed out of a descending channel on the 2-hour chart after establishing higher lows and reclaiming the 50-EMA at $3,246. The breakout was confirmed as price cleared the horizontal resistance at $3,286, with bullish candles stacking up and MACD momentum flipping firmly positive.
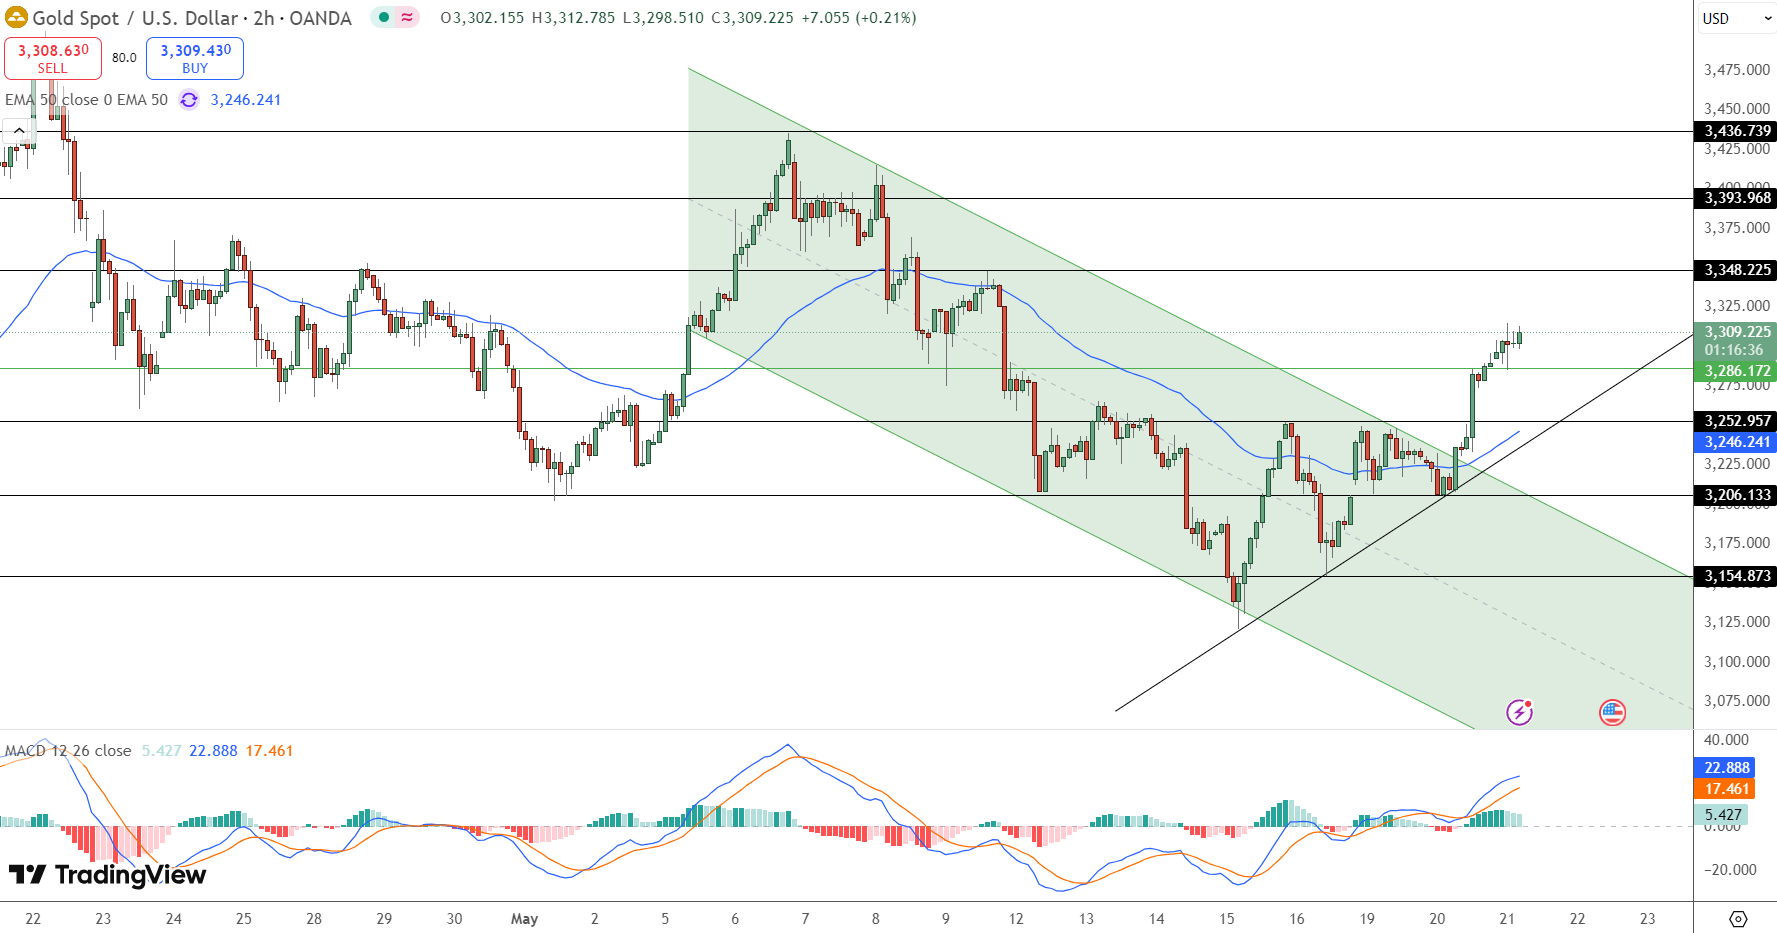
Price action is now riding an ascending trendline formed off the May 14 low, with potential to stretch toward $3,348 and even $3,393 if bullish momentum holds.
Trade Setup (Bullish Bias):
-
Entry: Pullback to $3,286 or breakout above $3,310
-
Stop Loss: Below $3,246 (EMA/trendline confluence)
-
Targets: $3,348, $3,393
Traders watching this move will want to see price hold above $3,286 for confirmation. As long as momentum stays intact, this looks like a textbook breakout-and-retest play—fueled by macro drama and a weakening U.S. dollar.
- Check out our free forex signals
- Follow the top economic events on FX Leaders economic calendar
- Trade better, discover more Forex Trading Strategies
- Open a FREE Trading Account