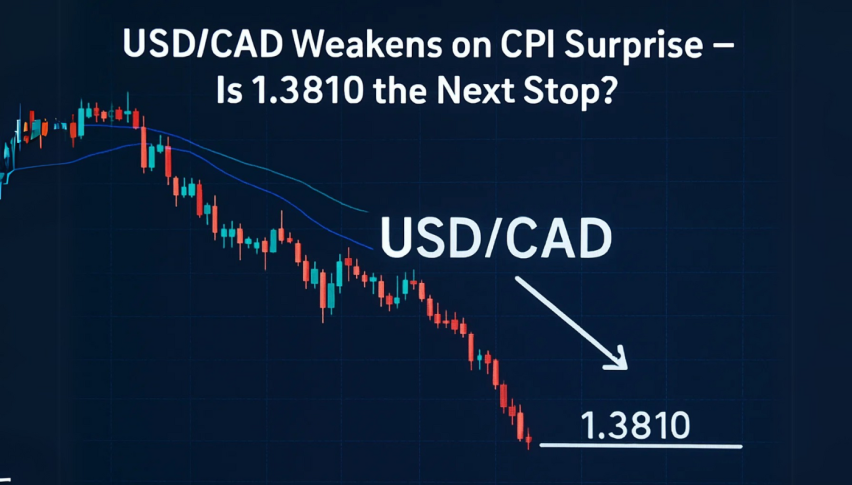
USD/CAD Weakens on CPI Surprise—Is 1.3810 the Next Stop?
The Canadian Dollar rallied on Wednesday after a mixed inflation report muddied the Bank of Canada’s (BoC) rate outlook...
Quick overview
- The Canadian Dollar strengthened after a mixed inflation report influenced the Bank of Canada's rate outlook.
- April's headline CPI rose to 1.7% year-over-year, surpassing expectations but showing a monthly decline of 0.1%.
- In the US, attention is focused on a House vote regarding President Trump's tax bill, which may impact the US Dollar amid long-term fiscal concerns.
- Technical analysis indicates a bearish trend for USD/CAD, with key support levels identified for potential sell-off opportunities.
The Canadian Dollar rallied on Wednesday after a mixed inflation report muddied the Bank of Canada’s (BoC) rate outlook and sent USD/CAD sellers back in. Statistics Canada reported April’s headline CPI rose 1.7% year-over-year, beating the 1.6% forecast but down from 2.3% in March. However, on a monthly basis, inflation declined 0.1%, missing the 0.5% estimate.
Core inflation—which excludes food and energy—rose 0.5% month-over-month, taking the year-over-year core CPI to 2.5% from 2.2%. This divergence suggests inflation is easing overall but core pricing is sticky and may prevent the BoC from cutting rates too aggressively. As a result, the Canadian Dollar found support while USD/CAD sold off.
Trump’s Tax Bill and Fed Speakers Weigh on the US Dollar
In the US, attention is on today’s House vote on President Trump’s “One Big Beautiful Bill” to extend the 2017 tax cuts and add more stimulus. While markets like the short-term growth implications, long-term fiscal concerns—especially a national debt projected to reach 134% of GDP—will cap US Dollar gains.
Meanwhile, traders are parsing comments from several Fed officials, including Barkin and Daly, for signs of policy shifts. Comments will be watched for any dovish tilts that could support rate cuts in the second half of 2025.
Technical Analysis: Triangle Breakdown Accelerates Sell-Off
USD/CAD has broken down further on Wednesday, taking out the symmetrical triangle on the 2-hour chart. Price has broken below 1.3911 and is now at 1.3888, with momentum below the 50-period EMA (1.3942) which is now resistance.
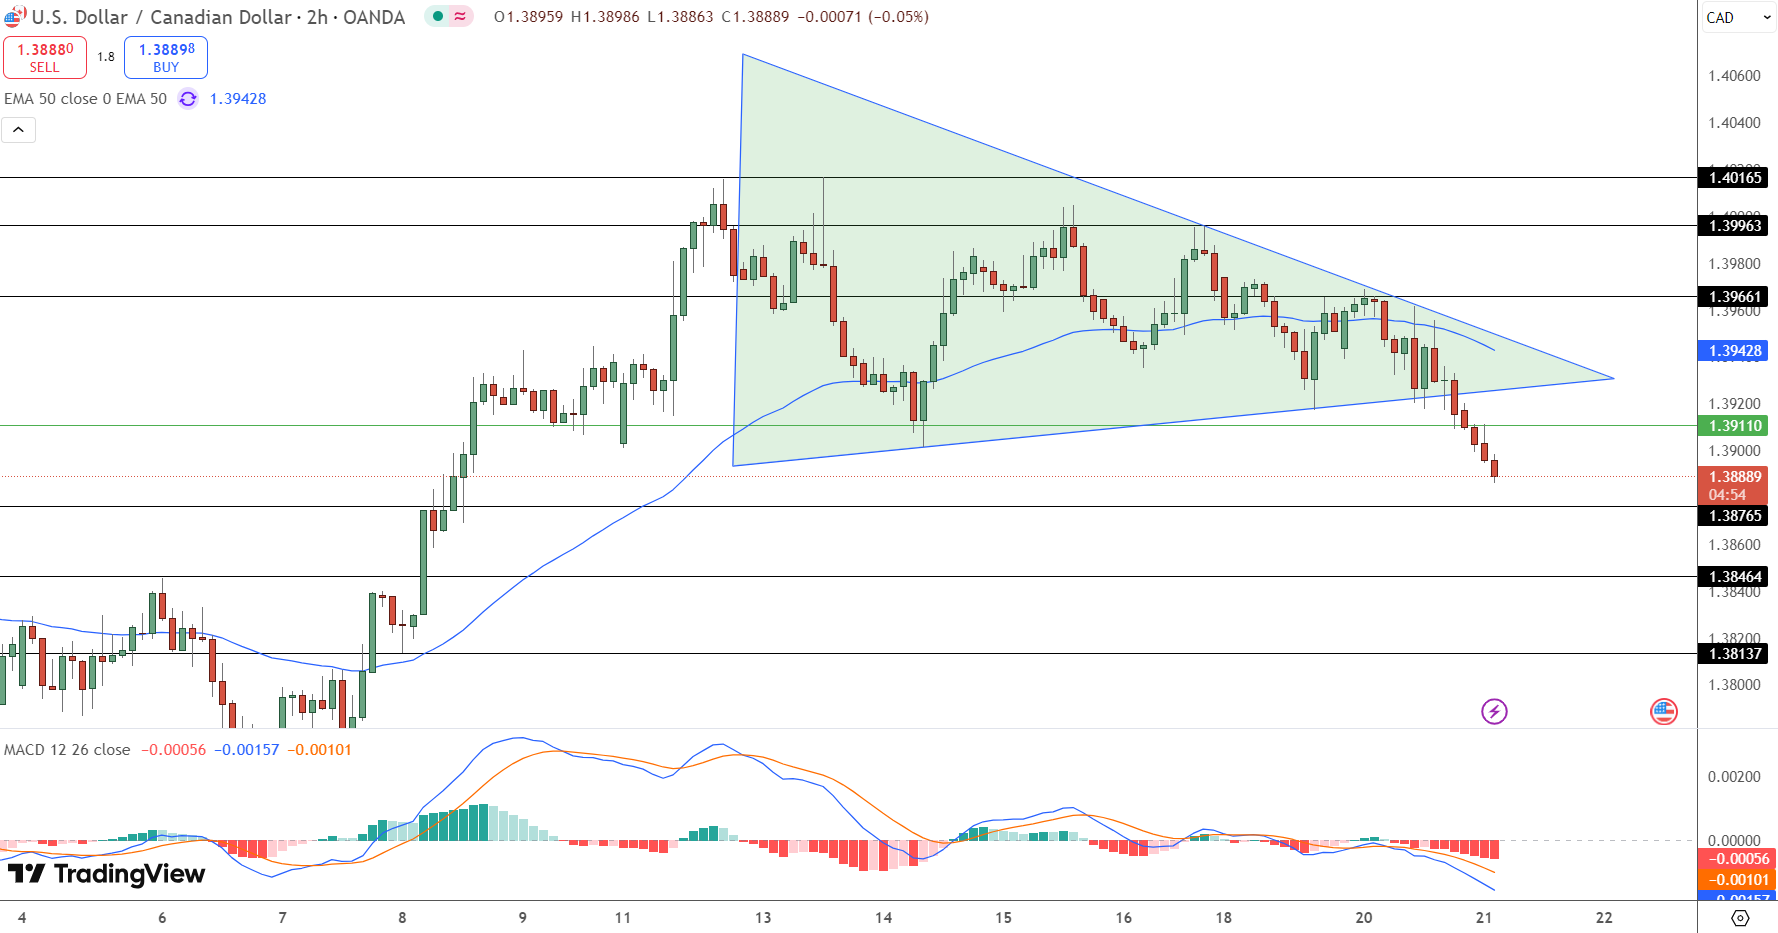
The bearish confirmation is further supported by the MACD which is deep in the red with widening histogram bars. This means more bearish pressure and a move towards key support zones.
Immediate targets:
-
1.3876 – minor support
-
1.3846 – prior swing low
-
1.3813 – measured move target from the triangle
Trade Setup (Bearish Bias):
-
Entry: Below 1.3910
-
Stop Loss: Above 1.3945
-
Targets: 1.3876, 1.3846, 1.3813
With the breakdown gaining traction, look for any retests of 1.3911–1.3941 as potential short entries. A hold below 1.3876 could be the start of a deeper sell off.
- Check out our free forex signals
- Follow the top economic events on FX Leaders economic calendar
- Trade better, discover more Forex Trading Strategies
- Open a FREE Trading Account


