Solana Price Prediction: SOL Hovers at $154 With Whale Transfer & $323M Losses
Solana at $154 after whale sell-off and $323M losses. Can Chainlink CCIP and Solana App Kit trigger a breakout?
Quick overview
Solana SOL/USD is at $153.97, down 1.61% in the last 24 hours, holding onto a crucial support zone. The recent dip is due to a big whale transfer of almost 1 million SOL—worth around $161 million—causing investors to get cautious. Net realized losses are $323 million at $156, showing the ripple effect of this big sell off.
SOL also went below the 34-day EMA ($163.20) with increasing volume, bearish momentum is intensifying. But it’s still above the critical support zone of $150-$156 with the 50-day and 100-day moving averages.
Key points:
- Whale transfer: ~$161 million in SOL
- Net losses: $323 million at $156
- Critical support: $150-$156 with aligned moving averages
Solana Ecosystem Growth: Chainlink CCIP and Solana App Kit
While the price is choppy, Solana’s ecosystem is growing. Chainlink’s Cross-Chain Interoperability Protocol (CCIP) is now live on Solana—its first deployment on a non-EVM blockchain. This is big for Solana’s cross-chain DeFi. Chainlink was big for Ethereum.
Solana also released its Solana App Kit, an open-source toolkit to build mobile dApps fast. This supports over 18 protocols, simplifies app creation for wallets, NFTs and DeFi platforms and will increase engagement on Solana’s fast network.
Highlights:
- Chainlink CCIP: Unlocks cross-chain DeFi for Solana
- Solana App Kit: Enables mobile dApp development
- Ecosystem momentum: More adoption and liquidity
Solana Technical Setup: Testing Support with Potential Rebound
On the 4-hour chart, SOL’s price is in a classic ascending triangle setup. Price is testing the rising trendline support from early May, but the recent lower highs and the dip from $177.58 shows seller dominance. The 50-period EMA ($165.04) and 200-period EMA ($163.18) are now resistance, confirming the bearish bias.
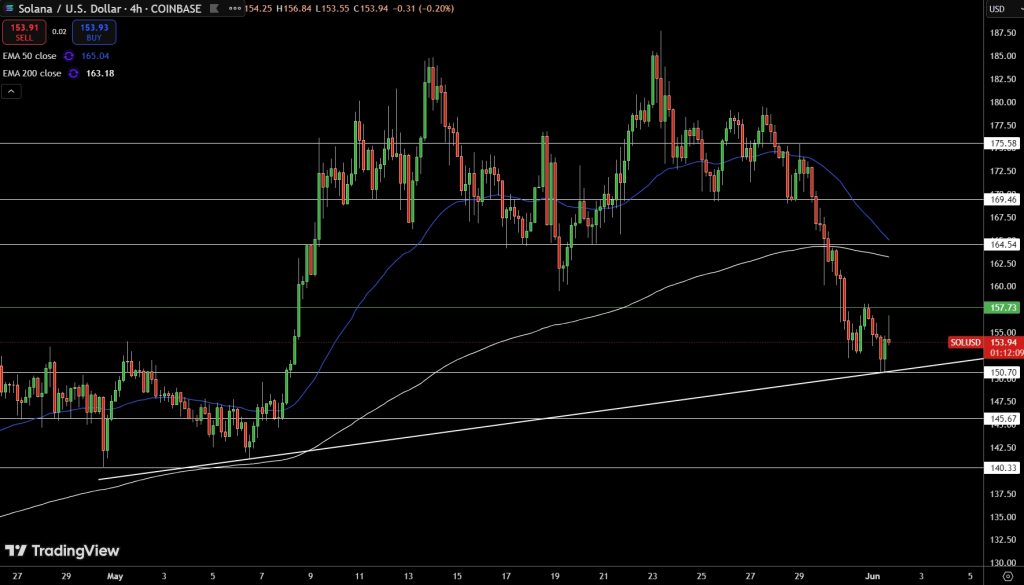
But higher lows since mid-May are showing buyers are coming in. If SOL holds $150.70 and forms a bullish candlestick pattern—like a Hammer or Bullish Engulfing—backed by MACD convergence, we could see a move to $157.73 or higher.
Key levels to watch:
- Support: $150.70, $145.67, $140.33
- Resistance: $157.73, $163.18, $165.04
For newbies, patience is key. Wait for a clear buy signal at $150.70—a strong candlestick pattern with increasing volume—before getting in. Without confirmation, the downside is open. But a bounce here could be a good long opportunity to $157-$165.
- Check out our free forex signals
- Follow the top economic events on FX Leaders economic calendar
- Trade better, discover more Forex Trading Strategies
- Open a FREE Trading Account
- Read our latest reviews on: Avatrade, Exness, HFM and XM
Related Articles


Sidebar rates
Related Posts
